
Visualizing Basic Properties of Definite Integrals
Loading the math board and drawing, please wait…
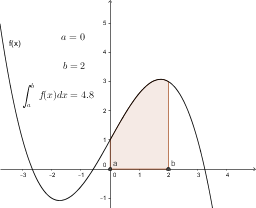
This GeoGebra example demonstrates the fundamental properties of definite integrals, such as linearity, additivity over intervals, and reversal of limits, through interactive graphs. It visualizes the geometric meaning of the integral as the signed area under a curve over real intervals, using shaded regions and dynamic text labels. The construction employs the Integral command to create integral objects, with function f, bounds a and b, value I, and text elements (text1, text2, text3) displaying the relevant formulas. Suitable for high school or introductory college calculus, it aids in understanding algebraic rules of integration from a visual perspective, ideal for classroom demonstrations or self-study.
GeoGebra Commands & Parameters
Integral(f, a, b) → I
AI Drawing Prompt Reference
Draw a function graph and visualize the geometric meaning of its definite integral, showing the signed area under the curve. Demonstrate the fundamental properties of definite integrals, such as linearity, additivity over intervals, and reversal of limits, by dynamically adjusting the bounds. Use shaded regions to represent the integral area and include dynamic text labels displaying relevant formulas and integral values to illustrate algebraic rules of integration.
The prompt above was compiled from the original drawing commands and is for reference only.