
Continuous Chapman Layer (Algebraic)
Loading the math board and drawing, please wait…
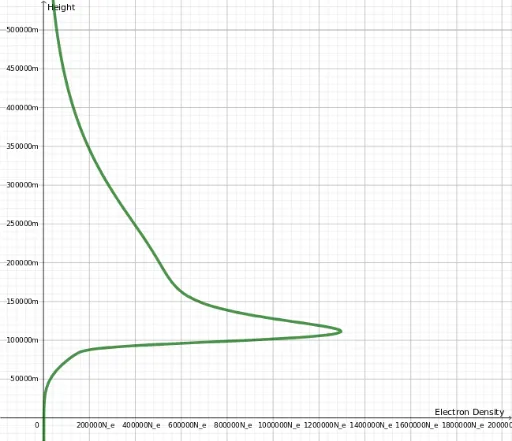
① This example demonstrates the algebraic modeling of a continuous Chapman layer in the ionosphere, showing the electron density distribution as a function of altitude with adjustable parameters and statistical characteristics. ② Core mathematical concepts include differential equations, definite integrals, frequency distributions, statistical measures, and inequalities, involving the Chapman function and layer structure parameters in atmospheric physics. ③ Construction highlights: Using GeoGebra commands such as Textfield, Segment, and Mirror, the applet provides interactive input boxes (InputBox1, InputBox3, InputBox6) and checkboxes (CasillaDeEntrada1-5), with objects like n_0, χ, z_{0E}, g_{Z0E}, M_E, T_e, N_{0E}, etc. Sliders and text dynamically adjust parameters, plotting curves for functions f, g, f_1, and using mirror tools to show symmetric layer structures. ④ Suitable for university-level physics or applied mathematics courses on ionospheric modeling, differential equation applications, and statistical distributions, as well as for research-based learning to explore how parameter changes affect layer shape.
GeoGebra Commands & Parameters
Textfield(M_F) → InputBox1Textfield(N_{0F}) → InputBox3Textfield(M_{E}) → InputBox6Segment((0, 0), (10^(12), 10^(12))) → gMirror(f, g) → f_1Textfield(χ) → CasillaDeEntrada1Textfield(T_e) → CasillaDeEntrada2Textfield(N_{0E}) → CasillaDeEntrada3Textfield(z_{0E}) → CasillaDeEntrada4Textfield(z_{0F}) → CasillaDeEntrada5
AI Drawing Prompt Reference
Draw a continuous Chapman layer model in the ionosphere, with electron density on the horizontal axis and altitude on the vertical axis. Include a main curve and its mirror image across a diagonal line, showing symmetric layer structure. Provide multiple input boxes and checkboxes for adjusting parameters such as peak density, scale height, solar zenith angle, and electron temperature. Use sliders and dynamic text to update the curves as parameters change, and display auxiliary elements related to integrals, differential equations, and statistical measures. The graph is intended for university-level physics teaching to explore how parameter variations affect layer shape.
The prompt above was compiled from the original drawing commands and is for reference only.