
Basic Properties of Definite Integrals by Joseph Walsh
Loading the math board and drawing, please wait…
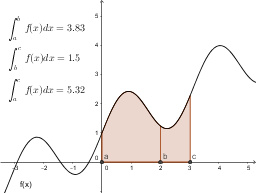
This example demonstrates the basic properties of definite integrals. It visually illustrates the linearity of integrals, the additivity of the integration interval, and the relationship between integrals and function graphs. The Integral command is used to draw the integrals, and slider animation is employed to adjust the integration interval. Suitable for high school mathematics education and learning.
GeoGebra Commands & Parameters
Integral(f, a, b) → I1Integral(f, b, c) → I2Integral(f, a, c) → I3
AI Drawing Prompt Reference
Draw a function graph on a coordinate plane, showing the basic properties of definite integrals. Use three shaded regions in different colors to represent the integrals of the function over intervals [a,b], [b,c], and [a,c], where the third region is the union of the first two, illustrating additivity of the integration interval. Include sliders to adjust a, b, and c, so the shaded areas and corresponding integral values update dynamically, demonstrating linearity. The figure should have axes, the curve, filled regions, and numerical labels for the integral values.
The prompt above was compiled from the original drawing commands and is for reference only.