
Visualizing Absolute Value Inequalities
Loading the math board and drawing, please wait…
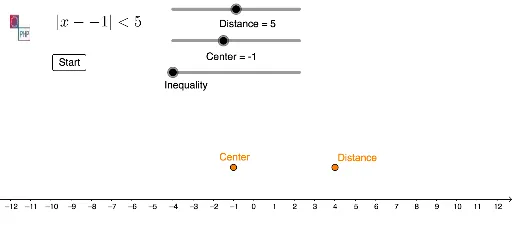
This example dynamically demonstrates how absolute value inequalities are represented as regions in the coordinate plane. Key math concepts include absolute value, solution sets of inequalities, and area representation. GeoGebra commands like If, Segment, Ray, and objects such as Center, Distance, A, B are used to construct the visualization. Suitable for high school students learning the geometric meaning of absolute value inequalities, and also useful for calculus and analytical geometry instruction.
GeoGebra Commands & Parameters
If(steps > 0 ∧ steps ≤ 1, Segment[A, (x(A) + (steps * Distance), 1)], steps > 1, Segment[A, B]) → fIf(steps > 0 ∧ steps ≤ 1, Segment[A, (x(A) - (steps * Distance), 1)], steps > 1, Segment[A, (x(A) - Distance, 1)]) → gIf(1 < steps < 2, Segment[(x(B), 0), (x(B), (2 * (steps - 1)))], steps ≥ 2, Segment[(x(B), 0), (x(B), 2)]) → hIf(1 < steps < 2, Segment[(x(A) - Distance, 0), (x(A) - Distance, (2 * (steps - 1)))], steps ≥ 2, Segment[(x(A) - Distance, 0), (x(A) - Distance, 2)]) → iIf(1 < steps < 2, Segment[(x(A) - Distance, 0), (x(A) - Distance, (2 * (steps - 1)))], steps ≥ 2, Segment[(x(A) - Distance, 0), (x(A) - Distance, 2)]) → jIf(1 < steps < 2, Segment[(x(B), 0), (x(B), (2 * (steps - 1)))], steps ≥ 2, Segment[(x(B), 0), (x(B), 2)]) → kSegment((x(A) - Distance, 0), (x(A) + Distance, 0)) → lRay((x(B), 0), (20, 0)) → mRay((x(A) - Distance, 0), (-20, 0)) → n
AI Drawing Prompt Reference
Visualize the solution set regions of absolute value inequalities in the coordinate plane, showing how key points and line segments represent the geometric meaning of inequalities. Start with a horizontal line segment, then extend line segments from key points in both directions based on conditions, and finally add two rays to indicate infinite extensions, forming the shape of the solution set for absolute value inequalities.
The prompt above was compiled from the original drawing commands and is for reference only.