
Visualizing a System of Linear Equations: Intersection of Two Lines
Loading the math board and drawing, please wait…
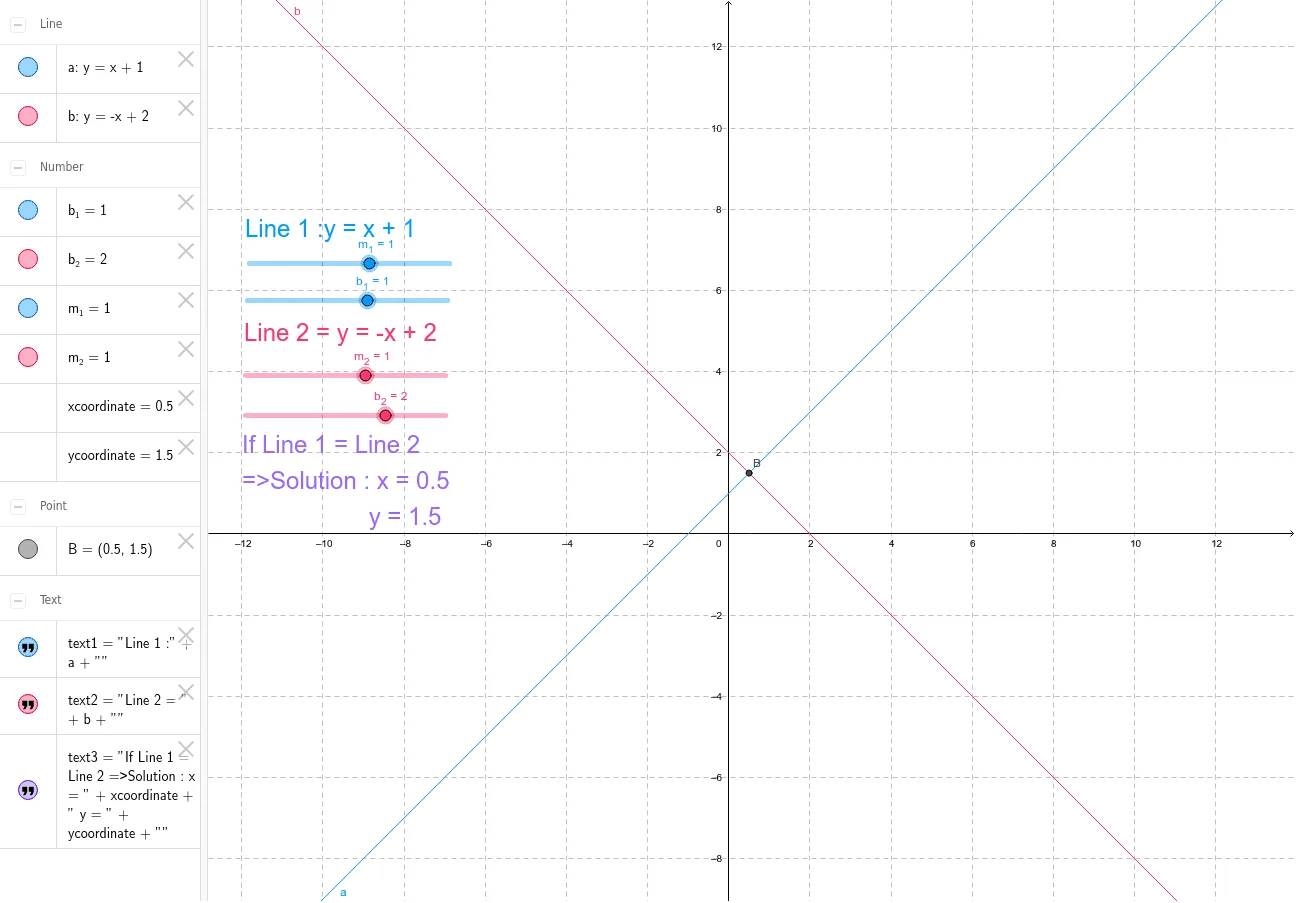
① This example dynamically visualizes a system of two linear equations, where the solution corresponds to the intersection point of the two lines. ② Core mathematical concepts include linear equations, slope and intercept, solving systems of equations (unique, no, or infinite solutions), and coordinate geometry of intersection points. ③ Construction highlights: The GeoGebra command Intersect is used to find the intersection point B of two lines defined by parameters m_1, b_1, a, m_2, b_2, b; the xcoordinate and ycoordinate objects extract the coordinates of B, while text1, text2, and text3 display the equations and coordinate values, allowing real-time updates as parameters change. ④ Suitable for middle school to high school students learning systems of linear equations, analytic geometry, or the connection between algebra and geometry; also useful for teachers creating interactive lessons to illustrate the geometric meaning of solutions.
GeoGebra Commands & Parameters
Intersect(a, b) → B
AI Drawing Prompt Reference
Draw a coordinate plane with two straight lines, each controlled by adjustable slope and intercept parameters via sliders. Mark the intersection point of the two lines clearly, and display its x- and y-coordinates nearby. Also show the equations of both lines and the coordinate values as text on the graph, updating dynamically as parameters change. The layout should clearly illustrate the geometric meaning of a system of two linear equations with a unique solution at the intersection.
The prompt above was compiled from the original drawing commands and is for reference only.