
Graphical Solution of a Pair of Linear Equations
Loading the math board and drawing, please wait…
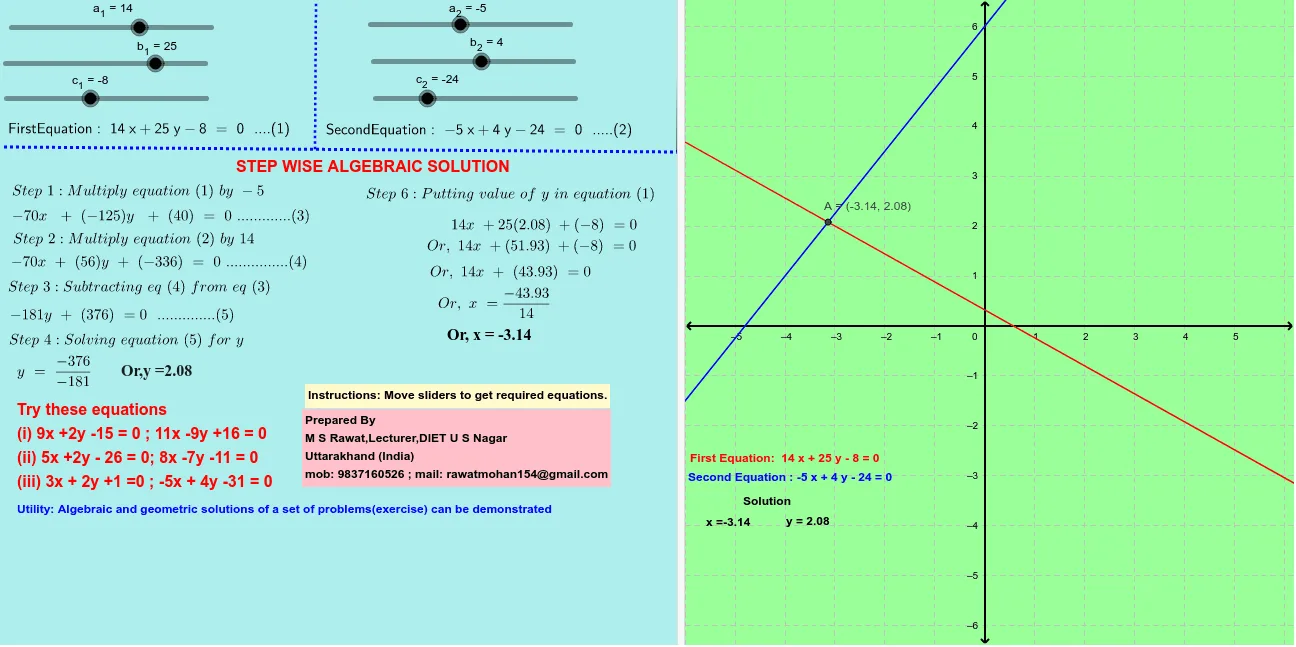
This example demonstrates the solution of a pair of linear equations by plotting straight lines on a Cartesian plane. The coordinates of the intersection point represent the values of the variables. It utilizes GeoGebra commands like Segment, Point, and Intersect to construct the graph, involving core mathematical concepts such as equations, linear equations, and coordinate geometry. Key construction steps include drawing lines, finding intersections, and labeling coordinates. Suitable for middle school and above students to understand the geometric meaning of solutions to systems of equations.
GeoGebra Commands & Parameters
Segment(B, C) → cSegment(C, D) → dPoint(c) → ESegment(E, F) → eIntersect(c, d) → GIntersect(c, e) → HIntersect(b, a) → A
AI Drawing Prompt Reference
Draw two lines with equations y = 2x + 1 and y = -x + 4. First, draw the line y = 2x + 1, then draw the line y = -x + 4. Next, find the intersection of these two lines, whose coordinates represent the solution to the system of equations. Finally, label the coordinates of the intersection point.
The prompt above was compiled from the original drawing commands and is for reference only.