
Visualization of Derivative
Loading the math board and drawing, please wait…
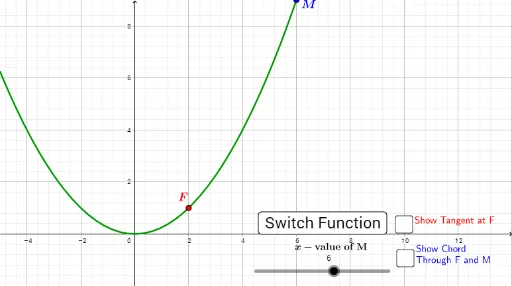
This example demonstrates the concept of derivatives. By drawing a function and its tangent, it shows the relationship between derivatives and the slope of the function. It uses commands like Tangent and Line, suitable for high school math education.
GeoGebra Commands & Parameters
Tangent(O1, f1) → t1Tangent(O2, f2) → t2Tangent(O3, f3) → t3Tangent(O4, f4) → t4Line(A1, O1) → s1Line(A2, O2) → s2Line(A3, O3) → s3Line(A4, O4) → s4
AI Drawing Prompt Reference
Draw a function graph and mark four points on it. For each point, draw a tangent line and connect the point to the tangent line, showing the relationship between the tangent and the function, used to illustrate the concept of derivatives for high school math education.
The prompt above was compiled from the original drawing commands and is for reference only.