
Visualization of Derivative Part 2
Loading the math board and drawing, please wait…
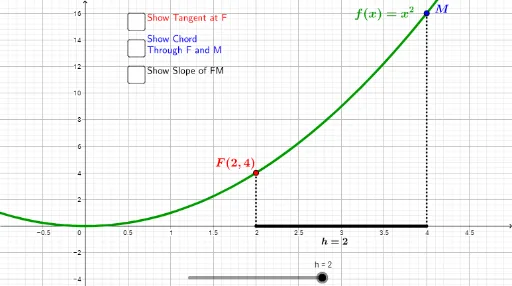
This example demonstrates the visualization of derivatives, involving key mathematical concepts such as derivatives and limits. Using GeoGebra commands like Tangent, Line, and Segment, it constructs tangent lines and line segments to help understand the geometric meaning of derivatives. Suitable for high school mathematics education and learning.
GeoGebra Commands & Parameters
Tangent(O1, f1) → t1Line(A1, O1) → s1Segment(A1, (x(A1), 0)) → fSegment(O1, (2, 0)) → gSegment((2, 0), (x(A1), 0)) → iMidpoint(i) → AMidpoint(A1, O1) → B