
Visualisation of Curve Sketching PQ12: Intersections, Asymptotes, and Trigonomet
Loading the math board and drawing, please wait…
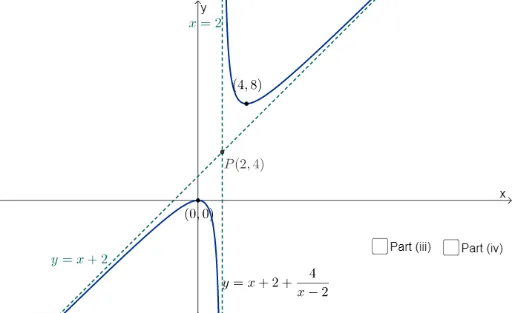
This GeoGebra example visualizes the process of curve sketching for a function involving trigonometric components, highlighting intersections, asymptotes, and the interplay with linear programming concepts. The core mathematical concepts include finding intersection points of curves, determining vertical or horizontal asymptotes, understanding periodic behavior of trigonometric functions, and exploring feasible regions in linear optimization. The construction uses the Intersect command to compute intersection points, Point to mark key locations, and defines asymptotes (asymptote1, asymptote2) along with auxiliary objects such as text1 and lines c, d, e, a, g, m, l. This resource is suitable for high school or introductory college students learning systematic curve analysis, and for teachers demonstrating step-by-step graphing techniques. By manipulating parameters, learners can observe how intersections and asymptotes shift, reinforcing the connection between algebraic expressions and their graphical representations.
GeoGebra Commands & Parameters
Intersect(f, xAxis, (0, 0)) → APoint(f) → BIntersect(asymptote1, asymptote2) → P