
Exercise 5: Integrated Exploration of Quadratic Equations, Logarithmic Functions
Loading the math board and drawing, please wait…
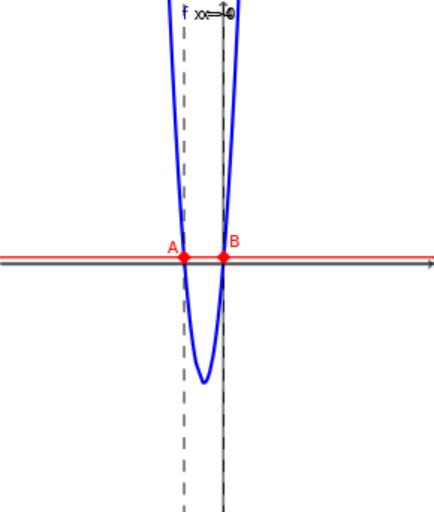
This comprehensive exercise demonstrates the interplay between quadratic equations, logarithmic functions, cosine functions, and optimization problems within a dynamic geometry environment. It visualizes how symmetry and coordinate geometry can be used to analyze relationships among these mathematical concepts. The construction leverages GeoGebra commands such as RandomElement, Random, Textfield, Intersect, OrthogonalLine, and TableText, along with objects like points (A, B, A1, B1), functions (f, g, h), sliders, buttons, and input boxes to allow interactive parameter adjustments. Users can explore how changing inputs affects intersections, perpendicular lines, and table outputs, reinforcing understanding of function behavior and extremum problems. This exercise is suitable for high school or introductory college students, serving as a hands-on tool for teachers and learners to deepen comprehension of multi-topic mathematical problem-solving.
GeoGebra Commands & Parameters
RandomElement({-5, -4, -3, -2, -1, 1, 2, 3, 4, 5}) → cRandom(-20, 20) → dRandom(-20, 20) → bRandomElement({-5, -4, -3, -2, -1, 1, 2, 3, 4, 5}) → aTextfield(m) → InputBox1Random(-10, 10) → pIntersect(f, k) → A, BOrthogonalLine(A, i) → gOrthogonalLine(B, i) → hTableText({{A1, B1}, {-3, f(-3)}, {-2, f(-2)}, {-1, f(-1)}, {0, f(0)}, {1, f(1)}, {2, f(2)}, {3, f(3)}}, "|_r") → text3
AI Drawing Prompt Reference
Create a dynamic math exploration diagram featuring a quadratic curve, a logarithmic curve, and a cosine curve. Randomly generate two intersection points between the quadratic and another curve, then draw perpendicular lines through each intersection point to a reference line. Include an input box for adjusting a parameter, and a table showing the quadratic function's values at integer points from -3 to 3. The layout should highlight intersections, perpendicular constructions, and the numerical table, allowing observation of how parameter changes affect the graph.
The prompt above was compiled from the original drawing commands and is for reference only.