
Visual Sequence Generator Based on Quadratic Function
Loading the math board and drawing, please wait…
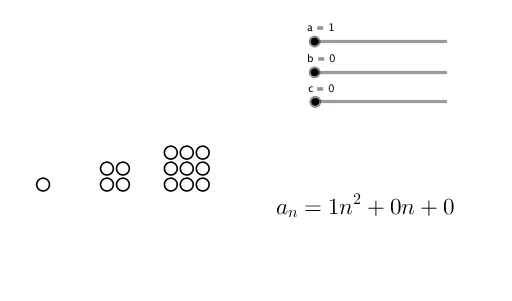
This example demonstrates visual patterns generated based on a given quadratic function. It involves key mathematical concepts such as quadratic functions, sequences, and series. Using the Sequence command in GeoGebra, a series of graphics based on the quadratic function can be generated. Suitable for high school mathematics education and learning about quadratic functions and their graphs.
GeoGebra Commands & Parameters
Sequence(Sequence[Sequence[Circle[((4 * i) + m, n), 0.4], n, 1, (i * a)], m, 1, i], i, 1, 3) → L_2Sequence(Sequence[Sequence[Circle[((4 * i) + m, (-n) + 1), 0.4], n, 1, b], m, 1, i], i, 1, 3) → L_1Sequence(Sequence[Circle[((5 * i) + 1, m - b), 0.4], m, 1, c], i, 1, 3) → L_3