
Visual Addition of Fractions: Interactive Sector-Based Demonstration
Loading the math board and drawing, please wait…
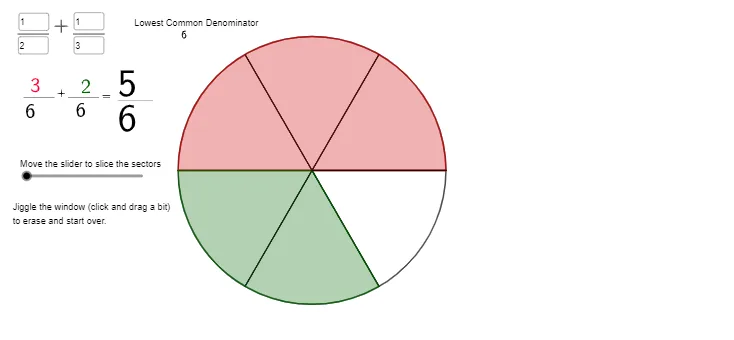
① This GeoGebra example demonstrates the visual process of adding two fractions using circular sectors, where each fraction is represented as a part of a circle, and the sum is updated interactively. ② The core mathematical concepts include fraction addition, finding common denominators, using the greatest common divisor (GCD) for simplification, and connecting fractions to angles and sector areas. ③ Construction highlights: from the summary, the example employs the GCD command to compute common denominators, Textfield and InputBox for user input, Rotate and Angle to adjust sector orientations, CircleSector to draw fraction regions, and Segment with LaTeX for labels and formulas. Key objects include v, u, B, A, b, g, h, eq1, InputBox1-4, and multiple text objects (text1-text12) to provide real-time feedback. ④ This resource is suitable for upper elementary to middle school students learning fraction operations, as well as for teachers demonstrating the geometric and algebraic steps of fraction addition in a classroom setting.
GeoGebra Commands & Parameters
GCD(b, u) → gTextfield(a) → InputBox1Textfield(b) → InputBox2Textfield(s) → InputBox3Textfield(u) → InputBox4Rotate(A, c, B) → A'Angle(A, B, A') → αRotate(A', d, B) → A''Angle(A', B, A'') → βCircleSector(B, A, A') → eCircleSector(B, A', A'') → fLaTeX(h, true, false) → text2Rotate(A, ((2 * π) * v / h), B) → A'_{1}Segment(B, A'_{1}) → iLaTeX(j, true, false) → text4LaTeX(h, true, false) → text5LaTeX(k, true, false) → text6LaTeX(h, true, false) → text7LaTeX(l, true, false) → text9LaTeX(h, true, false) → text10
AI Drawing Prompt Reference
Create an interactive diagram for adding fractions using sector pieces. Provide input fields for two numerators and a common denominator-related value, and use the GCD idea to determine a shared denominator. Construct a circle centered at one point, then define two sector boundary rays by rotating around the center; measure the two corresponding angles and label them α and β. Draw two CircleSector regions from the center using these rays to represent the two fractions, and set their orientations so they reflect the common-denominator partition. Place several LaTeX-style text labels to show intermediate values and the resulting expressions, including the displayed denominators and the angle-based fractions.
The prompt above was compiled from the original drawing commands and is for reference only.