
Virus Lab Simulation: Exponential Modeling and Data Fitting
Loading the math board and drawing, please wait…
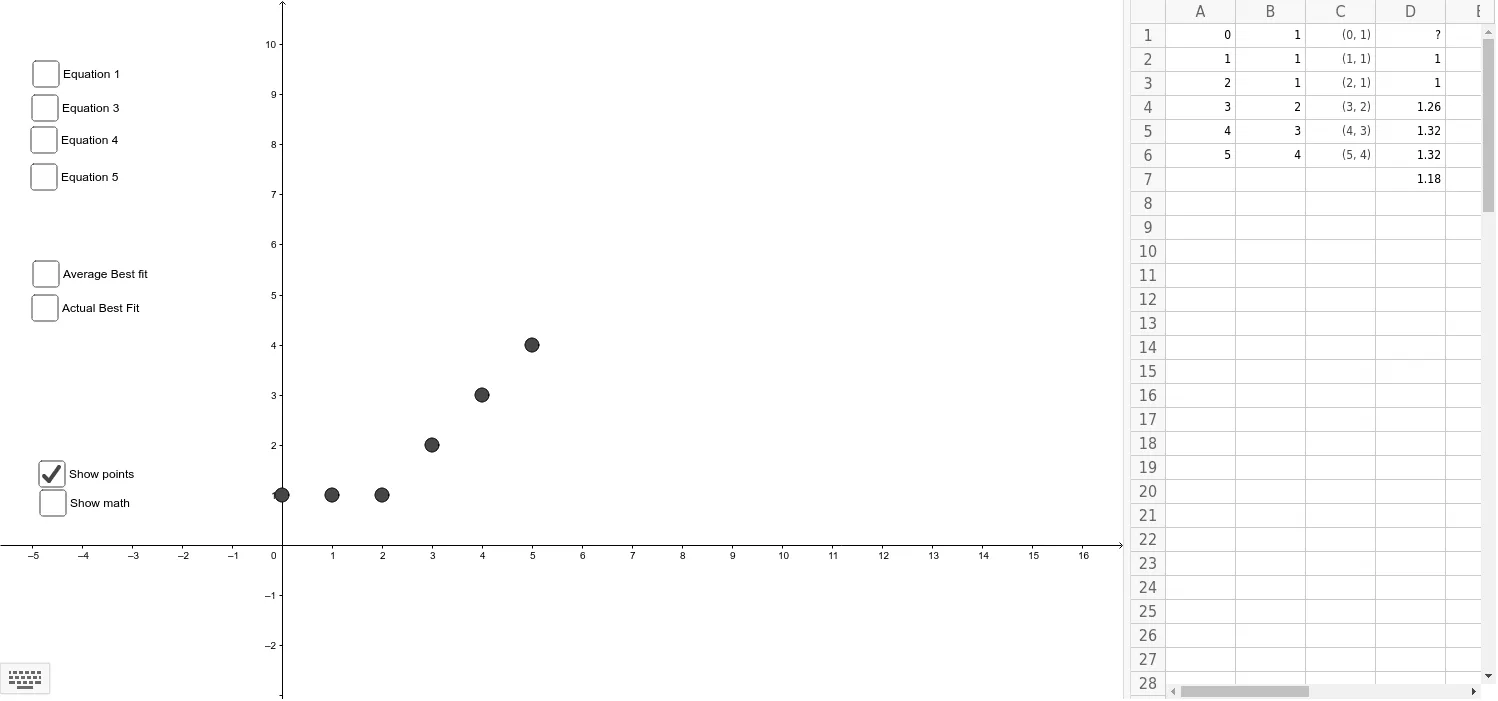
① This example simulates the spread of a virus in a laboratory setting, demonstrating how an exponential function can describe quantity growth over time, with GeoGebra used for data fitting and graphical analysis. ② Core mathematical concepts include exponential functions, function fitting (using the Fit command), mean calculation, data points and statistical characteristics, as well as comparison between the fitted curve and observed data. ③ Construction highlights: The Fit command is applied to experimental data points (e.g., B1 to B6) to generate an exponential function f; Mean computes the average of data; Segment connects relevant points or auxiliary lines; numerous objects (A1-A6, C1-C6, D1-D6, etc.) build the data list list1, and parameters a, b, c are adjusted to optimize the fit. ④ Suitable for high school or early college students learning exponential functions, data modeling, and statistics, as well as for biology or science courses illustrating virus spread through mathematical simulation, helping learners connect real-world phenomena to mathematical models.
GeoGebra Commands & Parameters
Fit(list1, (C * a^(x))) → fMean(D8:D8) → cMean(D1:D6) → dSegment(A, B) → mMean(D2:D6) → D7