
VIBE Sphere
Loading the math board and drawing, please wait…
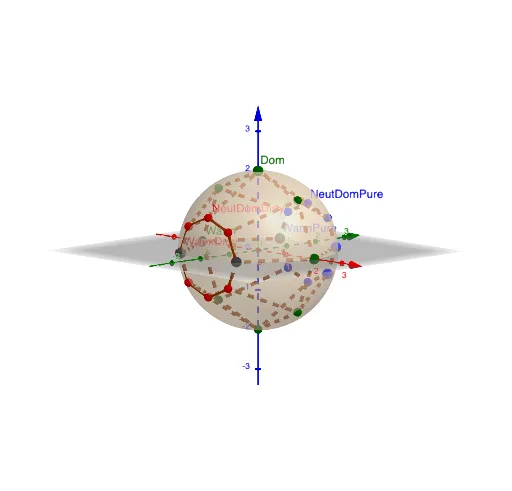
This example demonstrates a dynamic sphere model integrating colors and geometric shapes to illustrate concepts like volume and frequency distribution. Core mathematical concepts include sphere volume calculation, polygon construction, angle measurement, and function graphing. GeoGebra commands used in construction are Point, Angle, Sphere, and Polygon. Suitable for high school students and math enthusiasts exploring solid geometry, function graphs, and geometric constructions.
GeoGebra Commands & Parameters
Point({-2, 0, 0}) → WarmPoint({0, 0, 2}) → DomPoint({0, 0, -2}) → SubPoint({-1.41, 0, 1.41}) → WarmDomPoint({-1.41, 0, -1.41}) → WarmSubPoint({1.41, 0, -1.41}) → ColdSubPoint({1.41, 0, 1.41}) → ColdDomPoint({0, 0, 0}) → ZeroAxisPoint({0, 1.73, 1}) → NeutDomPureAngle(ZeroAxis, WarmPure, NeutDomPure) → αSphere(ZeroAxis, Warm) → aPolygon(Cold, ColdPure, 6, xOyPlane) → poly1, f, D, g, h, i, j, k, A, B, CPolygon(Dom, ColdDom, Cold, ColdSub, Sub, WarmSub, Warm, WarmDom) → poly2, dom, colddom, cold, coldsub, sub, warmsub, warm, warmdomPoint({0, 1.73, -1}) → NeutSubPurePoint({0.707, 1.73, 0.707}) → ColdDomPurePoint({-0.707, 1.73, 0.707}) → WarmDomPurePoint({-0.707, 1.73, -0.707}) → WarmSubPurePoint({0.707, 1.73, -0.707}) → ColdSubPurePoint({0, -1.73, 1}) → NeutDomDirtyPoint({0, -1.73, -1}) → NeutSubDirtyPoint({0.707, -1.73, 0.707}) → ColdDomDirtyPoint({-0.707, -1.73, 0.707}) → WarmDomDirtyPoint({-0.707, -1.73, -0.707}) → WarmSubDirtyPoint({0.707, -1.73, -0.707}) → ColdSubDirtyPolygon(Dom, NeutDomPure, NeutSubPure, Sub, NeutSubDirty, NeutDomDirty) → poly3, l, neutdompure, neutsubpure, m, neutsubdirty, neutdomdirtyPolygon(Dom, WarmDom, WarmDomPure, NeutDomPure) → q1, n, p, warmdompure, qPolygon(WarmDom, Warm, WarmPure, WarmDomPure) → q2, r, s, warmpure, tPolygon(NeutDomPure, ColdDomPure, ColdPure, ColdSubPure, NeutSubPure, WarmSubPure, WarmPure, WarmDomPure) → poly4, b, colddompure, coldpure, coldsubpure, c, warmsubpure, d, ePolygon(Dom, ColdDom, ColdDomPure, NeutDomPure) → q3, f_1, g_1, h_1, i_1Polygon(ColdDom, Cold, ColdPure, ColdDomPure) → q4, j_1, k_1, l_1, m_1Polygon(Cold, ColdPure, ColdSubPure, ColdSub) → q5, n_1, p_1, q_1, r_1Polygon(ColdSubPure, NeutSubPure, Sub, ColdSub) → q6, s_1, t_1, a_1, b_1Polygon(WarmSubPure, NeutSubPure, Sub, WarmSub) → q7, c_1, d_1, e_1, f_2Polygon(Warm, WarmSub, WarmSubPure, WarmPure) → q8, g_2, h_2, i_2, j_2Polygon(WarmDom, WarmDomDirty, WarmDirty, Warm) → q9, k_2, warmdomdirty, warmdirty, l_2Polygon(Dom, NeutDomDirty, WarmDomDirty, WarmDom) → q10, m_2, n_2, p_2, q_2Polygon(Dom, ColdDom, ColdDomDirty, NeutDomDirty) → q11, r_2, s_2, colddomdirty, t_2Polygon(D, ColdDomDirty, ColdDom, Cold) → q12, d_2, a_2, b_2, c_2Polygon(D, ColdSubDirty, ColdSub, Cold) → q13, d_3, coldsubdirty, e_2, f_3Polygon(ColdSubDirty, NeutSubDirty, Sub, ColdSub) → q14, g_3, h_3, i_3, j_3Polygon(WarmSubDirty, NeutSubDirty, Sub, WarmSub) → q15, warmsubdirty, k_3, l_3, m_3Polygon(WarmSubDirty, C, B, WarmSub) → q16, n_3, c_3, b_3, p_3
AI Drawing Prompt Reference
Draw a dynamic sphere model showcasing colors and geometric shapes to illustrate volume and frequency distribution. Include a central sphere with multiple points forming colored polygons like hexagons and pentagons around it. Connect some points to create angles, highlighting spatial relationships. Start with the sphere and base points, then build the polygons, and finally use colors to differentiate regions, showing volume and frequency distribution.
The prompt above was compiled from the original drawing commands and is for reference only.