
Vertical Transformations Exploration
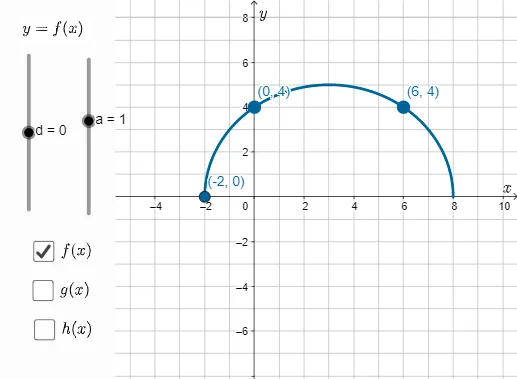
Loading the math board and drawing, please wait…
In collections
Grade 12 PreCalculus BC
This example demonstrates the vertical transformations of the function y=a(f(x)+d), focusing on the effects of coefficients a (stretch/compression) and constant d (translation). It involves core concepts like function transformations, using sliders for dynamic parameter adjustments, and GeoGebra commands such as If for graph construction. Ideal for high school mathematics education to visualize and understand translation and scaling of function graphs.
GeoGebra Commands & Parameters
If(a ≟ 1, "", If[a ≟ -1, "-", Text[a]]) → atextIf(d ≟ 0, "", If[d < 0, Text[d], ("+" * Text[d])]) → dtext
AI Drawing Prompt Reference
Create a graph showing vertical transformations of a function. The base function is f(x), transformed as y=a(f(x)+d). Use two sliders to control the coefficient a and the constant d. As a changes, the graph stretches or compresses; as d changes, the graph shifts vertically. Display the current values of a and d near the graph, showing the sign for a when it is 1 or -1, omitting d when zero, and adding a plus sign for positive d. The graph should have labeled axes and update dynamically with parameter changes.
The prompt above was compiled from the original drawing commands and is for reference only.