
Vertex Form of Quadratic Functions
Loading the math board and drawing, please wait…
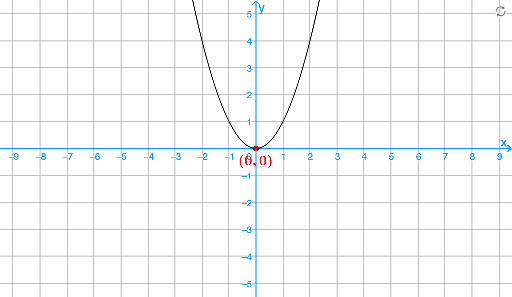
This example demonstrates the graph of a quadratic function in vertex form. Key mathematical concepts include quadratic functions, vertex form, and its graphical characteristics. By adjusting parameters like a, h, and k, you can observe changes in the graph. Objects like V, h, k, a, and c are used in the construction. Suitable for high school math education and learning.
GeoGebra Commands & Parameters
Point V(0, 0)x(V)y(V)Numeric a(1)y = (a * (x - h)^(2)) + kBoolean box1(true)Conic dBoolean box2(true)
AI Drawing Prompt Reference
Draw the graph of a quadratic function in vertex form, showing how changes in parameters a, h, and k affect the graph. Include the vertex, coordinate axes, and the function curve. Start by plotting the origin, then define the x and y axes. Set parameter a to an initial value of 1, and plot the curve y=a(x-h)^2+k. Display parameter sliders and the function graph.
The prompt above was compiled from the original drawing commands and is for reference only.