
Venn Diagram Overlap Demonstration
Loading the math board and drawing, please wait…
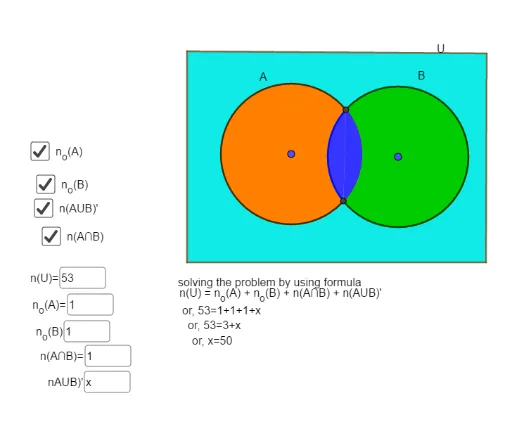
This example dynamically illustrates different overlapping parts in a Venn diagram, visually showcasing intersection and union operations in set theory; core math concepts include set theory intersections, unions, and Venn diagram representation; GeoGebra commands/objects used are Circle, Intersect, CircleArc, Point, Polygon, Textfield; suitable for high school set theory instruction and beginners understanding set relationships.
GeoGebra Commands & Parameters
Circle(A, 2) → cCircle(B, 2) → dCircle(A, 2) → eCircle(B, 2) → fIntersect(c, d) → C, D, ,Intersect(e, f) → E, F, ,CircleArc(A, F, E) → gCircleArc(B, E, F) → hCircle(A, 2) → kCircle(B, 2) → pCircleArc(A, F, E) → qCircleArc(B, E, F) → rPoint(yAxis) → GIntersect(xAxis, yAxis) → HPoint(xAxis) → IPolygon(G, H, I, J) → q1, g_1, h_1, i, jPolygon(G, H, I, J) → q2, g_2, h_2, i_1, j_1Textfield(u) → InputBox1Textfield(ao) → InputBox2Textfield(bo) → InputBox3Textfield(intersection) → InputBox4Textfield(u') → InputBox5
AI Drawing Prompt Reference
Draw two intersecting circles to represent set intersections and unions. First, draw two circles, then find their intersection points, and draw arcs between these points. Finally, use these points and the circle centers to draw polygons representing set relationships.
The prompt above was compiled from the original drawing commands and is for reference only.