
Venn Diagram Operations
Loading the math board and drawing, please wait…
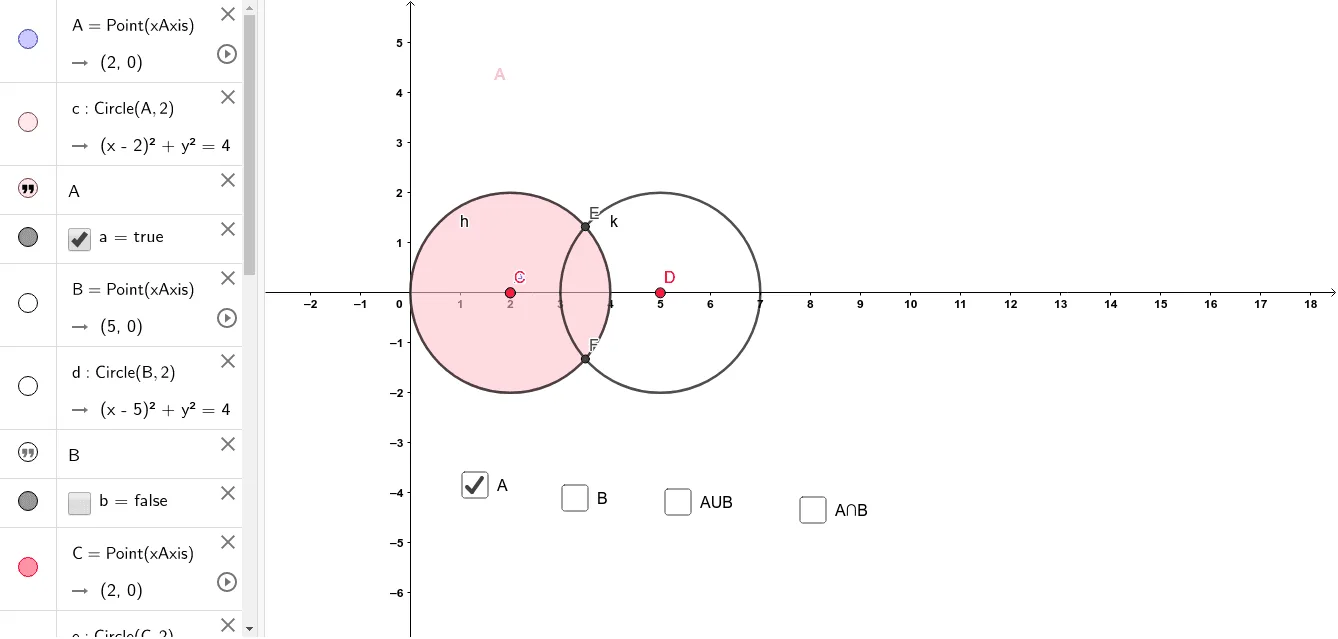
① This GeoGebra example dynamically demonstrates Venn diagram operations, including intersection, union, and complement, visually representing relationships between sets. ② Core mathematical concepts involve set theory operations, subset relations, and region partitioning in Venn diagrams, combined with statistical characteristics for categorical counting. ③ Construction highlights: from the summary, commands such as Point, Circle, Intersect, and CircleArc are used to create multiple circles (e.g., A, B, C, D) and their intersection points, with text objects (text1 to text4) labeling operation results, forming an interactive Venn diagram model. ④ Suitable for middle school to high school set theory lessons, as well as introductory discrete mathematics in college, helping students intuitively grasp geometric representations of set operations, and useful for teacher demonstrations or student self-exploration.
GeoGebra Commands & Parameters
Point(xAxis) → ACircle(A, 2) → cPoint(xAxis) → BCircle(B, 2) → dPoint(xAxis) → CCircle(C, 2) → ePoint(xAxis) → DCircle(D, 2) → fCircle(C, 2) → hCircle(D, 2) → kIntersect(h, k) → E, F, ,CircleArc(C, F, E) → pCircleArc(D, E, F) → q
AI Drawing Prompt Reference
Draw two intersecting circles C and D, then draw two arcs connecting the intersection points E and F to form the basic structure of a Venn diagram, illustrating the intersection and union of sets.
The prompt above was compiled from the original drawing commands and is for reference only.