
Venn Diagram Logic with Two Sets by thaemua (2)
Loading the math board and drawing, please wait…
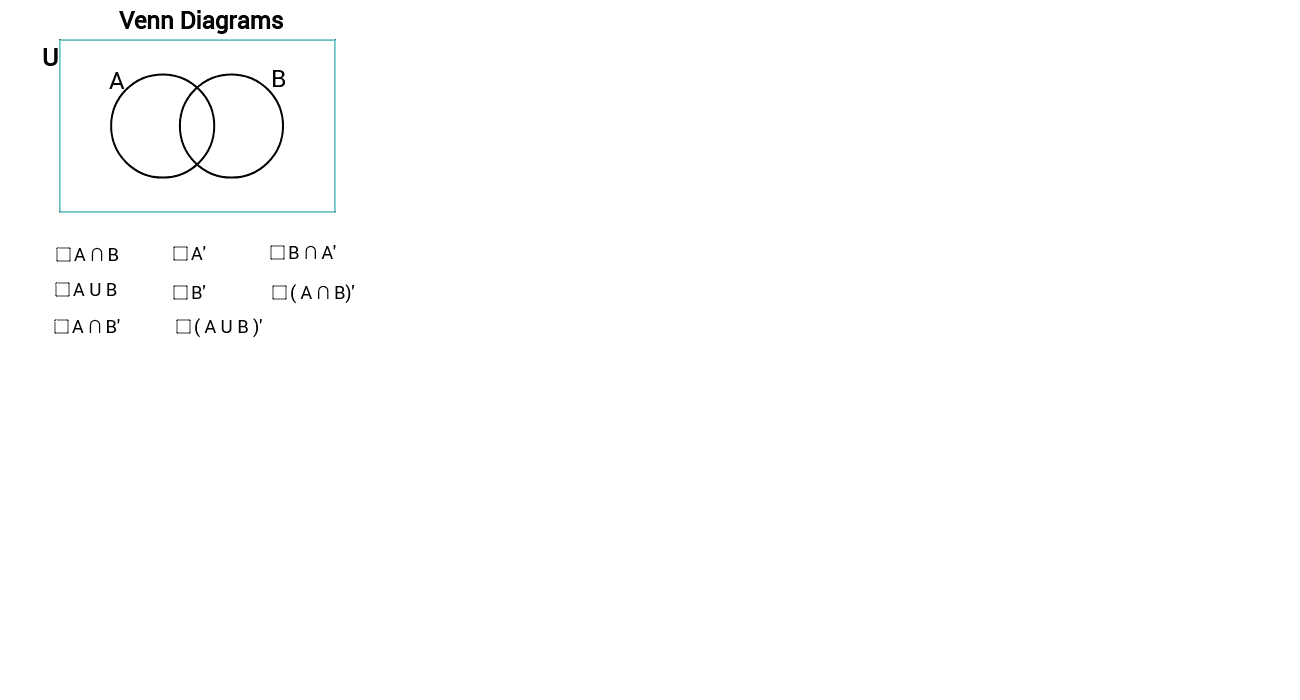
This GeoGebra example demonstrates the logic of Venn diagrams for two sets, visually illustrating regions such as intersection, union, and set differences. The core mathematical concepts involve set theory operations, logical reasoning, and graphical representation of set relationships. The construction uses GeoGebra commands including Point, Circle, Intersect, CircleArc, CircumcircleArc, and Polygon to create two overlapping circles and define distinct regions (objects like I, J, K, L, etc.). Text labels (text1, text2) are likely used to annotate set names. This resource is suitable for middle school or high school mathematics, as well as introductory logic courses, helping students grasp the correspondence between set operations and Venn diagrams. It can also serve as an interactive teaching tool for educators.
GeoGebra Commands & Parameters
Point(xAxis) → ECircle(E, 3) → ePoint(xAxis) → FCircle(F, 3) → fIntersect(e, f) → G, H, ,CircleArc(F, G, H) → gCircleArc(E, H, G) → hCircle(F, 3) → kCircle(E, 3) → pPoint(e) → APoint(f) → RCircumcircleArc(G, A, H) → sCircleArc(F, G, H) → tCircumcircleArc(G, R, H) → e_1CircleArc(E, H, G) → f_1Polygon(I, L, K, J) → poly4, i_1, l_1, k_1, j_1Circle(F, 2.95) → g_1Circle(E, 2.95) → h_1CircleArc(F, G, H) → q_1CircleArc(E, H, G) → r_1
AI Drawing Prompt Reference
Draw a Venn diagram with two intersecting circles. Start by drawing two circles with their centers on the x-axis, then find their intersection points. Draw arcs connecting the intersection points and the circle centers to define different regions. Finally, use a polygon to label the intersection, individual sets, and the outside area.
The prompt above was compiled from the original drawing commands and is for reference only.