
Illustrating Set Operations with Venn Diagrams (Copy)
Loading the math board and drawing, please wait…
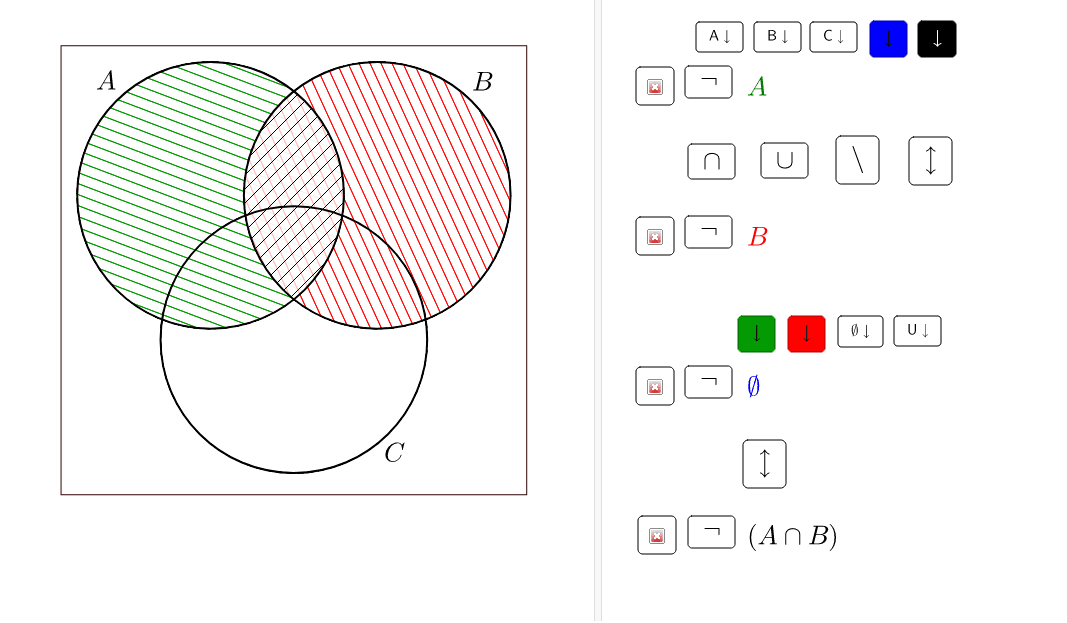
① This example demonstrates set operations such as union, intersection, and complement using Venn diagrams, providing a visual and interactive way to understand relationships between sets. ② Core mathematical concepts include sets, subsets, intersection, union, complement, and the graphical representation of set operations. ③ Construction details: The GeoGebra commands Circle and Polygon are used to create the circular regions representing sets and to construct overlapping areas or auxiliary polygons. Multiple points (e.g., A, B, C, E5, B5) and segments (a, b, c, d) are employed to label elements and operation results, making the diagram clear and easy to manipulate. ④ Suitable for middle school and high school mathematics lessons on sets, as well as introductory discrete mathematics courses; ideal for classroom demonstrations or self-paced exploration.
GeoGebra Commands & Parameters
Circle(A, 4) → cCircle(B, 4) → dCircle(C, 4) → ePolygon((-4.5, -9), (-4.5, 4.5), (9.5, 4.5), (9.5, -9)) → poly1, a, b, f, g
AI Drawing Prompt Reference
Draw three circles to represent sets A, B, and C, then draw a large rectangle to cover these circles, using the rectangle's edges to indicate the boundaries and intersection areas of the sets.
The prompt above was compiled from the original drawing commands and is for reference only.