
Geometric Distance-Constrained Optimization Construction
Loading the math board and drawing, please wait…
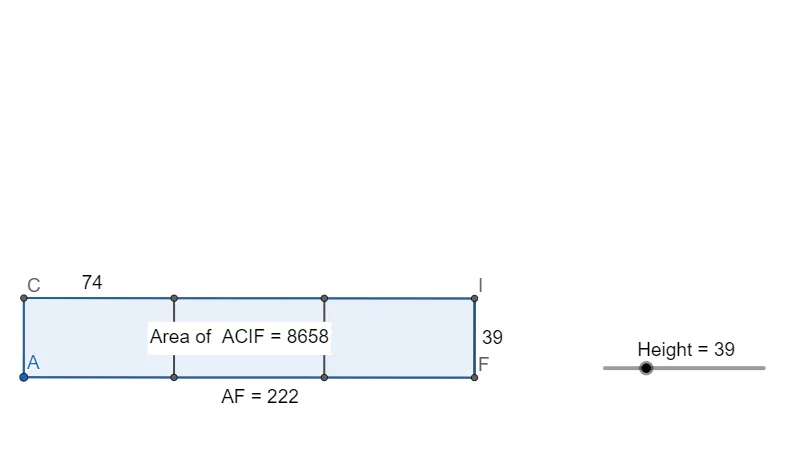
This example visualizes an optimization process under geometric constraints by constructing lines and circles, measuring key point-to-reference distances, and using height/distance quantities to compare candidates and identify an optimal configuration. It centers on core ideas such as distance-based optimization, circle–line (or circle–other) intersection to determine feasible points, and a function/height relationship interpreted through geometry. Construction workflow in GeoGebra: Line for constraint lines; OrthogonalLine to build perpendiculars and obtain heights/projections; Circle and Intersect to generate intersection points that serve as candidate solutions; Segment and Polygon to assemble and display the geometric figure; Distance to compute the objective metric (e.g., distanceAF); PointIn to determine region membership; and Text labeling (e.g., TextAF, Textq1) to present key computed parameters. Suitable for high-school through introductory university use, especially for teaching optimization thinking with geometric modeling and for exploratory graph/geometry-based problem solving.
GeoGebra Commands & Parameters
Line(A, B) → fOrthogonalLine(A, f) → gCircle(A, Height) → cIntersect(c, g, 2) → COrthogonalLine(C, g) → hCircle(A, (600 - (4 * Height)) / 2 / 3) → dIntersect(d, f, 2) → DOrthogonalLine(D, f) → iCircle(D, A) → eIntersect(e, f, 2) → ECircle(E, D) → kIntersect(k, f, 2) → FOrthogonalLine(F, f) → jOrthogonalLine(E, f) → lIntersect(h, i) → GSegment(C, G) → mIntersect(h, l) → HSegment(G, H) → nIntersect(h, j) → ISegment(H, I) → pSegment(I, F) → qSegment(F, E) → rSegment(E, D) → sSegment(D, A) → tSegment(A, C) → aSegment(G, D) → bSegment(E, H) → f_1Segment(I, F) → g_1Distance(A, F) → distanceAFPolygon(A, C, I, F) → q1, a_1, c_1, i_1, f_2PointIn(q1) → Pointq1
AI Drawing Prompt Reference
Draw a planar construction with a single constraint line and a fixed reference point. Through the reference point, draw a perpendicular line to the constraint line and use a height value along this perpendicular to define circles. Intersect those circles with the perpendicular to obtain the first candidate point, then from that candidate construct a new perpendicular to the constraint line. Build further circles using the new circle centers and the reference point, intersect them with the constraint line to generate additional candidate points. Connect the key points with segments to form a polygon, emphasizing the segment from the reference point to a selected candidate as the geometric measure, and include the perpendicular segments to represent height/projection relationships. Label the main computed quantities and indicate which candidate lies in the intended region.
The prompt above was compiled from the original drawing commands and is for reference only.