
Venn Diagram Example by Dr Brooks (7)
Loading the math board and drawing, please wait…
In collections
Statistics and Probability with Mr Downes
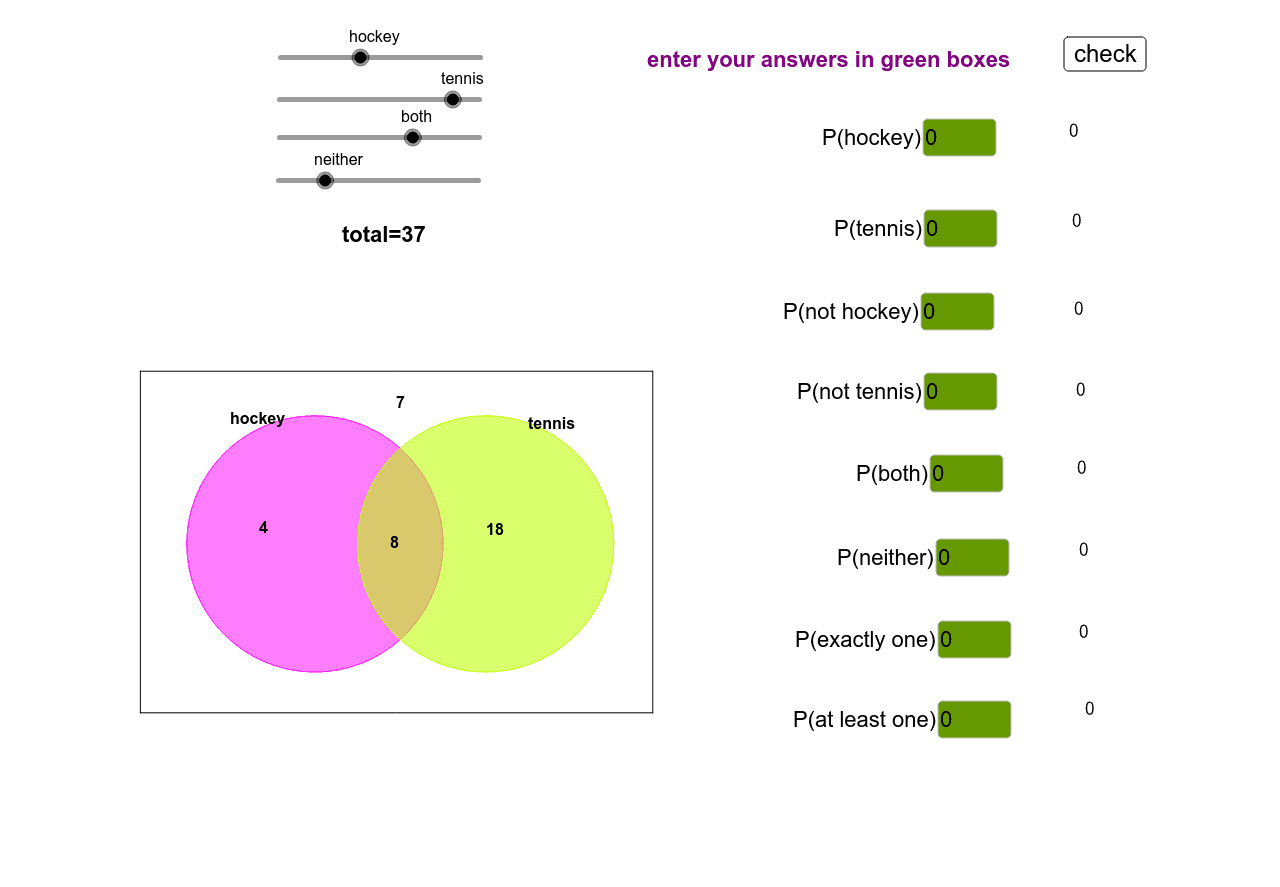
This example uses a Venn diagram to demonstrate basic concepts in probability theory. It involves the concept of sets and how to use GeoGebra commands to draw a Venn diagram. By examining the commands in the construction summary, such as Polygon, Point, Segment, one can understand how to use GeoGebra for geometric construction. Suitable for middle school and above students to learn probability and statistics.
GeoGebra Commands & Parameters
Polygon(B, C, D, A) → poly1, b, c, d, aPoint(xAxis) → ESegment(F, G) → eCircle(E, e) → fPoint(xAxis) → H_1Circle(H_1, e) → gFractionText(question1) → fraction1Textfield(question2) → inputBox2FractionText(question2) → fraction2Textfield(question1) → inputBox1Textfield(question3) → inputBox3Textfield(question4) → inputBox4Textfield(question5) → inputBox5Textfield(question7) → inputBox7Textfield(question6) → inputBox6Textfield(question8) → inputBox8FractionText(question3) → fraction3FractionText(question4) → fraction4FractionText(question5) → fraction5FractionText(question6) → fraction6FractionText(question7) → fraction7FractionText(question8) → fraction8
AI Drawing Prompt Reference
Draw a Venn diagram showing two circles and some polygons. The construction order is: first draw a polygon, then determine two points on the x-axis, then draw a line segment, then draw two circles with these points as centers, and finally add text boxes and input boxes to display questions and inputs.
The prompt above was compiled from the original drawing commands and is for reference only.