
Venn Diagram Example by Dr Brooks (3)
Loading the math board and drawing, please wait…
In collections
conditional probability page 2
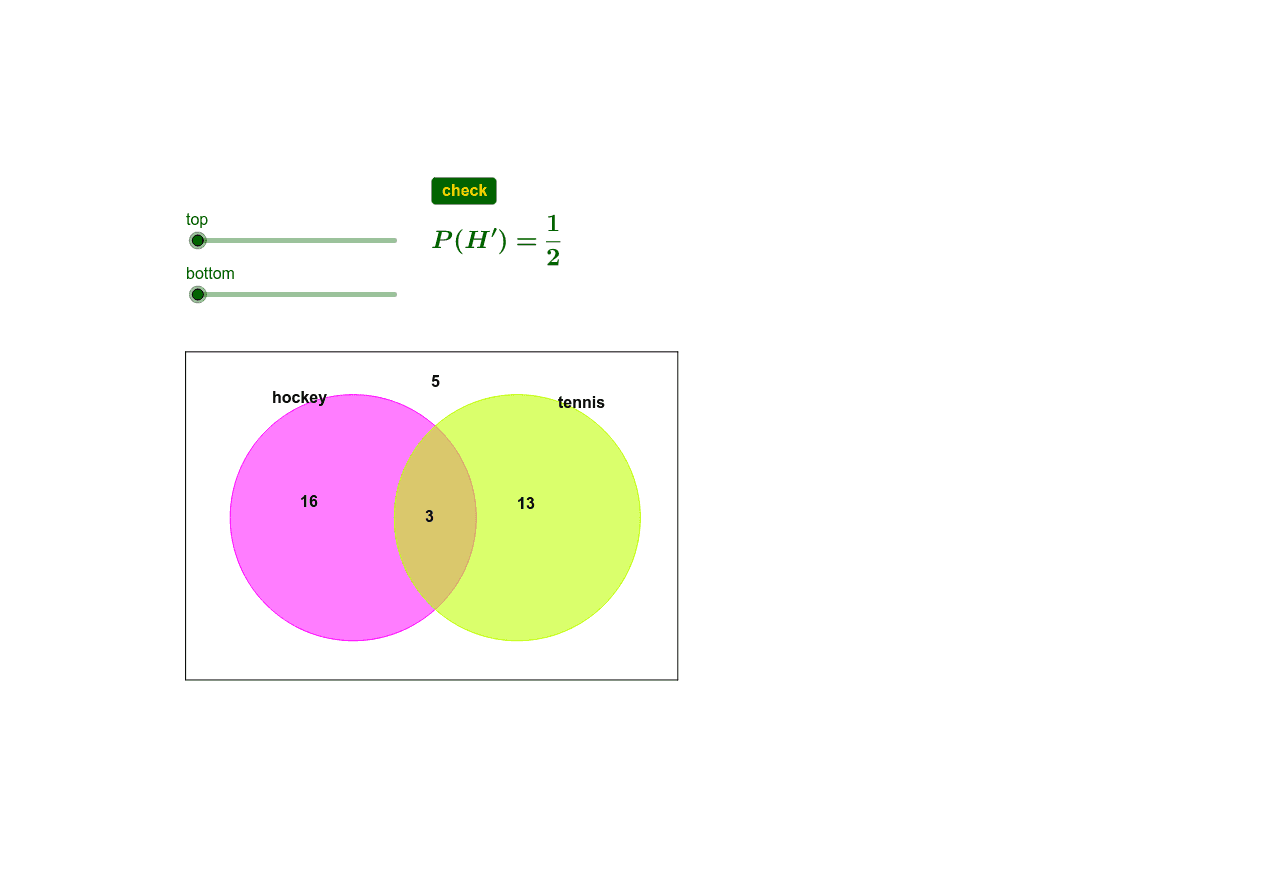
This example demonstrates how to use GeoGebra to create a Venn diagram, illustrating the relationships between sets; it involves core math concepts like set theory, logical operations, and geometric constructions; construction highlights include commands/objects like Polygon, Point, Segment, Circle, and If from the GeoGebra command summary; suitable for high school mathematics teaching, explaining set operations and logical relations, or data visualization education.
GeoGebra Commands & Parameters
Polygon(B, C, D, A) → poly1, b, c, d, aPoint(xAxis) → ESegment(F, G) → eCircle(E, e) → fPoint(xAxis) → H_1Circle(H_1, e) → gIf(GCD[top, bottom] ≟ 1, "", "=" + (FractionText[top / bottom])) → question1