
Velocity-Time Graph: Interactive Kinematics and Geometric Construction
Loading the math board and drawing, please wait…
In collections
Area and Volume
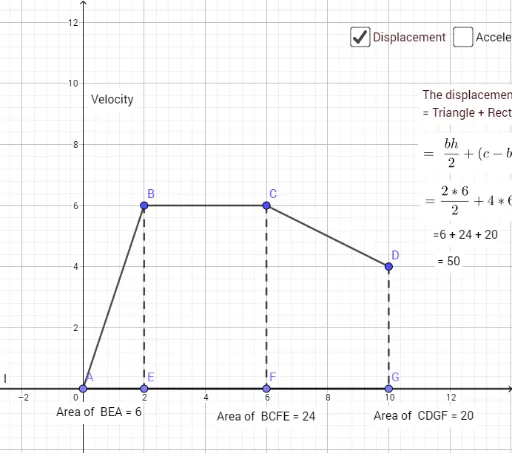
① This example demonstrates the construction and interpretation of a velocity-time (v-t) graph, showing how velocity changes over time through an interactive geometric setup. ② Core mathematical concepts include velocity, time, displacement (area under the curve), acceleration (slope), and the connection between function graphs and geometric objects such as points, segments, and polygons. ③ Construction highlights: Based on the summary, the GeoGebra commands used include Point, Segment, Slope, Polygon, and PointIn, creating multiple points (A, B, C, D, etc.), segments (f, g, h, etc.), slope objects (m, m_1), and text labels (text1, text2). The graph likely uses sliders or dynamic points to control the curve, and may incorporate additional elements like scalene triangles and binomial distribution, but the main focus is the velocity-time curve and its geometric measurements. ④ This is suitable for high school physics or mathematics lessons on kinematics and function graphing, as well as introductory calculus to visualize derivatives (slope) and integrals (area), or as a reference for designing interactive GeoGebra worksheets.
GeoGebra Commands & Parameters
Point(xAxis) → ASegment(A, B) → fSegment(B, C) → gSegment(C, D) → hSlope(f) → mSlope(h) → m_1Segment(B, E) → iSegment(C, F) → jSegment(D, G) → kSegment(A, E) → nSegment(E, F) → pSegment(F, G) → qPolygon(B, E, A) → t1, a_1, b_1, ePolygon(B, C, F, E) → q1, b_2, c, f_1, e_1Polygon(C, D, G, F) → q2, c_1, d, g_1, f_2PointIn(t1) → Pointt1PointIn(q1) → Pointq1PointIn(q2) → Pointq2Polygon(A, B, C, D, G) → poly1, a_2, b_3, c_2, d_1, g_2PointIn(poly1) → Pointpoly1_1PointIn(poly1) → Pointpoly1
AI Drawing Prompt Reference
Draw a velocity-time graph with four line segments f, g, h and i, j, k representing different time intervals of velocity change. Calculate the slopes m and m_1 for each segment, forming two triangles t1 and q1, and a quadrilateral poly1. Use point-in-polygon operations to obtain points Pointt1, Pointq1, and Pointpoly1.
The prompt above was compiled from the original drawing commands and is for reference only.