
Velocity, Position, and Acceleration vs. Time Graphs by Tom Walsh
Loading the math board and drawing, please wait…
In collections
animation Constructions
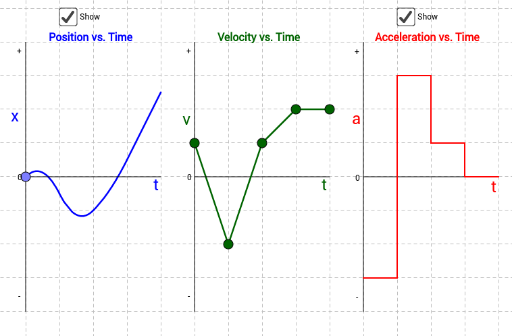
This example demonstrates how adjusting a Velocity vs. Time graph dynamically updates the corresponding Position vs. Time and Acceleration vs. Time graphs. Key math concepts include function graphs, special points, and the calculus relationship between velocity, position, and acceleration. Constructed using GeoGebra commands like Segment, Point, and Midpoint. Suitable for high school and above students learning kinematics and function graph relationships, or for physics instruction.
GeoGebra Commands & Parameters
Segment(A, B) → a_3Point(a_3) → RSegment((5, -4), (5, 4)) → m1Point(m1) → ESegment((6, -4), (6, 4)) → m2Point(m2) → FSegment(E, F) → aSegment((9, -4), (9, 4)) → m5Segment((8, -4), (8, 4)) → m4Segment((7, -4), (7, 4)) → m3Midpoint(a_3) → DSegment(D, C) → bSegment(A_1, B_1) → a_1Midpoint(a_1) → D_1Segment(D_1, C_1) → b_1Segment(A_2, B_2) → a_2Midpoint(a_2) → D_2Segment(D_2, C_2) → b_2Point(m3) → GSegment(F, G) → cPoint(m4) → HSegment(G, H) → dPoint(m5) → ISegment(H, I) → eSegment(J, K) → fSegment(K, L) → gSegment(L, M) → hSegment(M, N) → iSegment(N, O) → jSegment(O, P) → kSegment(P, Q) → l
AI Drawing Prompt Reference
Draw velocity-time, position-time, and acceleration-time graphs that dynamically update. Start by drawing a horizontal segment with perpendicular segments extending upward and downward from its ends to form a cross. Then add horizontal segments on both sides of the cross and mark key points on these segments. Finally, connect these points to form the graphs for velocity, position, and acceleration, showing their relationships.
The prompt above was compiled from the original drawing commands and is for reference only.