
Vector Relationship Inside a Function
Loading the math board and drawing, please wait…
In collections
Complex Math
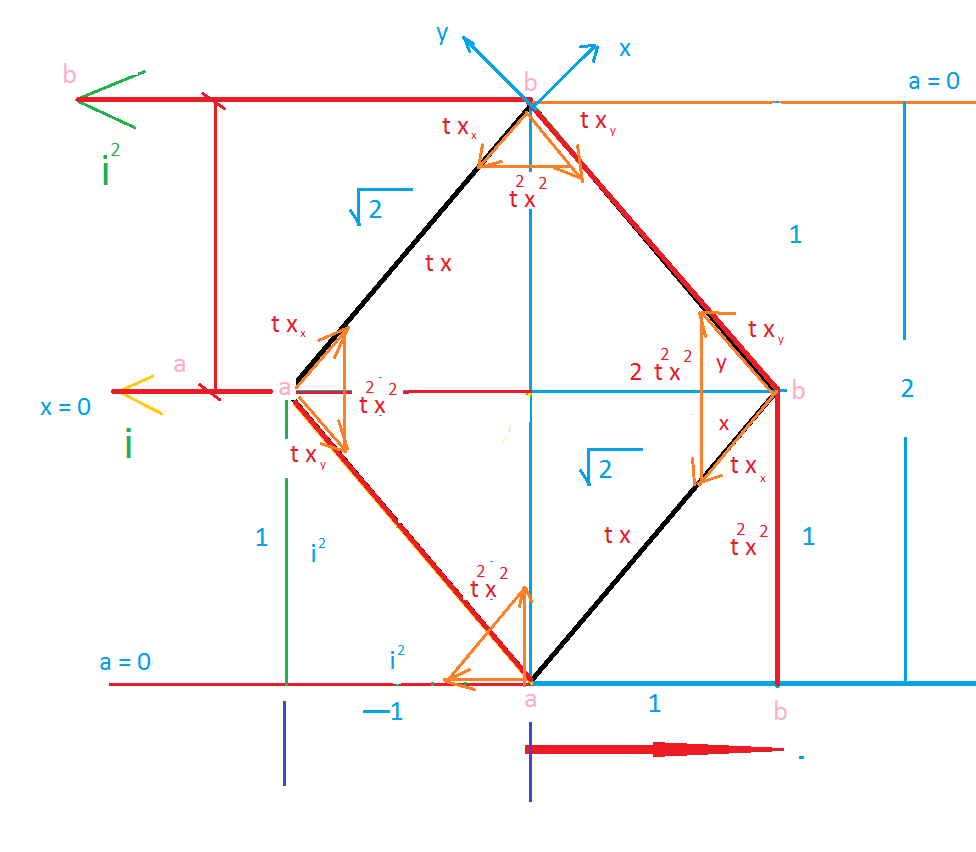
This example demonstrates the vector relationship inside a function, particularly the numerical values generated at key positions by a reference vector. For instance, at -1, the vector generates a value of 1.41. It uses commands like Intersect, Point, Segment, and Vector, suitable for high school mathematics education.
GeoGebra Commands & Parameters
Intersect(h, p, 1) → EPoint(g) → FSegment(F, E) → aVector(E, F) → u
AI Drawing Prompt Reference
Draw a vector relationship inside a function, showing the numerical values generated at key positions by a reference vector, such as a value of 1.41 at -1. Start by plotting a curve to represent the function, then identify and connect several key points on the curve to form a line segment, and finally draw a vector from one key point to another to illustrate the vector relationship.
The prompt above was compiled from the original drawing commands and is for reference only.