
Using Rectangles to Estimate Area Under a Curve
Loading the math board and drawing, please wait…
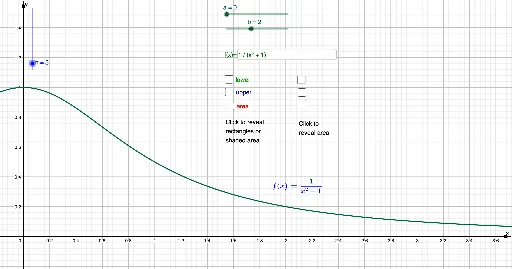
This example demonstrates how to estimate the area under a curve using rectangles. Key math concepts include area, rectangle, upper and lower sums or Riemann sums, continuity, percentages, mode, and subtraction. It utilizes GeoGebra commands and objects like LaTeX, LowerSum, UpperSum, Integral, Textfield; objects: f, text1, a, b, n, c, d, e, h, i, text2, g, text3, text4, j, k, l, text5, text6, InputBox1, text7. Suitable for high school or introductory college calculus students learning about integrals.
GeoGebra Commands & Parameters
LaTeX(f, true, true) → text1LowerSum(f, a, b, n) → cUpperSum(f, a, b, n) → dIntegral(f, a, b) → eTextfield(f) → InputBox1
AI Drawing Prompt Reference
Draw a function graph and show how to estimate the area under the curve using rectangles, including upper and lower Riemann sums and the actual integral area, with text annotations for the function expression and each part, starting with the function graph, adding rectangles and integral areas progressively, and finally labeling all calculation results.
The prompt above was compiled from the original drawing commands and is for reference only.