
Upper and Lower Riemann Sums – Visualizing Definite Integral Approximation
Loading the math board and drawing, please wait…
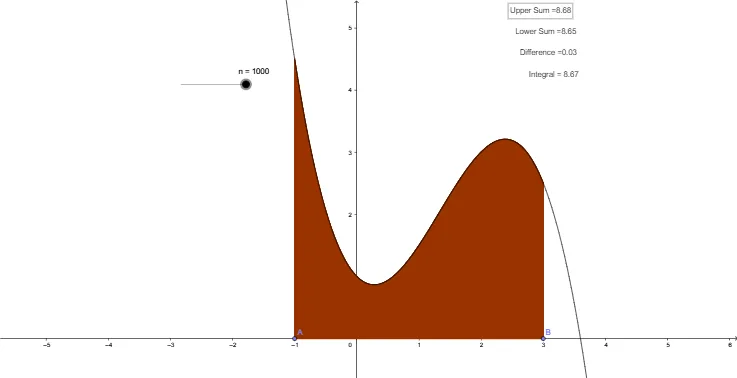
This example demonstrates how to construct upper and lower Riemann sums for a function f over an interval [a,b] and compare them with the definite integral using GeoGebra. The commands UpperSum, LowerSum, and Integral are employed, together with objects such as f, A, B, n, a, b, and sliders for dynamic exploration. Users can see how the upper and lower sums converge to the exact integral as the number of subintervals n increases. Core concepts include Riemann sums, upper and lower bounds, approximation of definite integrals, and the limit definition of integration. It is suitable for high‑school or first‑year university calculus courses.
GeoGebra Commands & Parameters
Point(xAxis) → APoint(xAxis) → BUpperSum(f, x(A), x(B), n) → aLowerSum(f, x(A), x(B), n) → bIntegral(f, x(A), x(B)) → F
AI Drawing Prompt Reference
Draw a function graph and represent the upper Riemann sum with rectangles above the interval and the lower Riemann sum with rectangles below it, while also showing the definite integral area under the function over the interval. Use a slider to adjust the number of subintervals and observe how the rectangles and the integral area relate as the number changes.
The prompt above was compiled from the original drawing commands and is for reference only.