
Unit Circle - Part 1
Loading the math board and drawing, please wait…
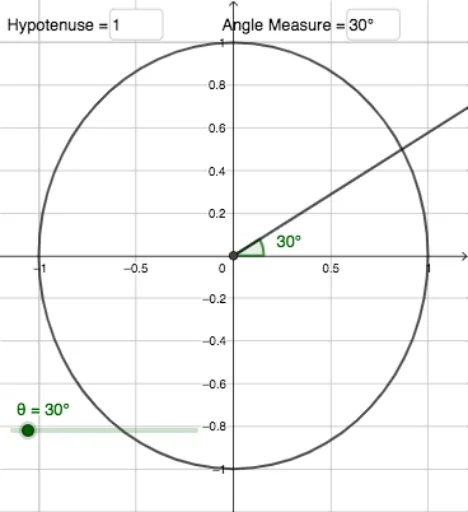
This example demonstrates the basic construction of the unit circle. Key mathematical concepts include the properties of circles and trigonometric functions. Using GeoGebra commands such as Intersect, Point, Line, etc., it dynamically shows the relationship between points on the unit circle and angles. Suitable for students in middle school and above learning geometry and trigonometry.
GeoGebra Commands & Parameters
Intersect(xAxis, yAxis) → KPoint(xAxis) → JPoint(yAxis) → GLine(G, xAxis) → iIntersect(k, i) → H, IAngle(H, K, J) → βIntersect(xAxis, yAxis) → FPoint(xAxis) → CLine(C, yAxis) → fCircle(C, Opposite) → dIntersect(d, f) → D, EAngle(E, F, C) → αCircle(A, a) → eTextfield(a) → InputBox1Point(e) → BTextfield(Opposite) → InputBox2Circle(F, b) → gElement(list, SideSetting) → hTextfield(A11) → InputBox3Circle(K, j) → pMirror(E, xAxis) → E'Mirror(H, yAxis) → H'Line(B, yAxis) → lIntersect(l, xAxis) → LOrthogonalLine(H, xAxis) → nOrthogonalLine(H', xAxis) → qIntersect(n, xAxis) → MIntersect(q, xAxis) → NTextfield(θ) → InputBox4Rotate(L, θ, F) → L'Angle(L, F, L') → δRay(F, L') → rTableText({{A1, B1, C1, D1}, {A2, B2, C2, D2}, {A3, B3, C3, D3}, {A4, B4, C4, D4}, {A5, B5, C5, D5}, {A6, B6, C6, D6}, {A7, B7, C7, D7}, {A8, B8, C8, D8}, {A9, B9, C9, D9}}, "|_") → text2TableText({{A11, B11}, {A12, B12}, {A13, B13}, {A14, B14}, {A15, B15}, {A16, B16}, {A17, B17}, {A18, B18}, {A19, B19}, {A20, B20}, {A21, B21}, {A22, B22}, {A23, B23}, {A24, B24}, {A25, B25}}, "|_") → text3
AI Drawing Prompt Reference
Draw a unit circle, start by marking the intersection K of the x-axis and y-axis, then take points J on the x-axis and G on the y-axis. Draw a line i through G and the x-axis, intersecting the circle at H and I, and calculate angle β. Next, draw a circle d with center on the x-axis and intersecting the y-axis at D and E, and calculate angle α. Draw a unit circle e with radius a, and a unit circle f with radius b. Reflect E and H to E' and H', draw perpendicular lines n and q to the x-axis, intersecting at M and N. Rotate L to get L', calculate angle δ, and draw ray r. Finally, plot the table based on given data.
The prompt above was compiled from the original drawing commands and is for reference only.