
Unit Circle and Sine Graph by matheagle (2)
Loading the math board and drawing, please wait…
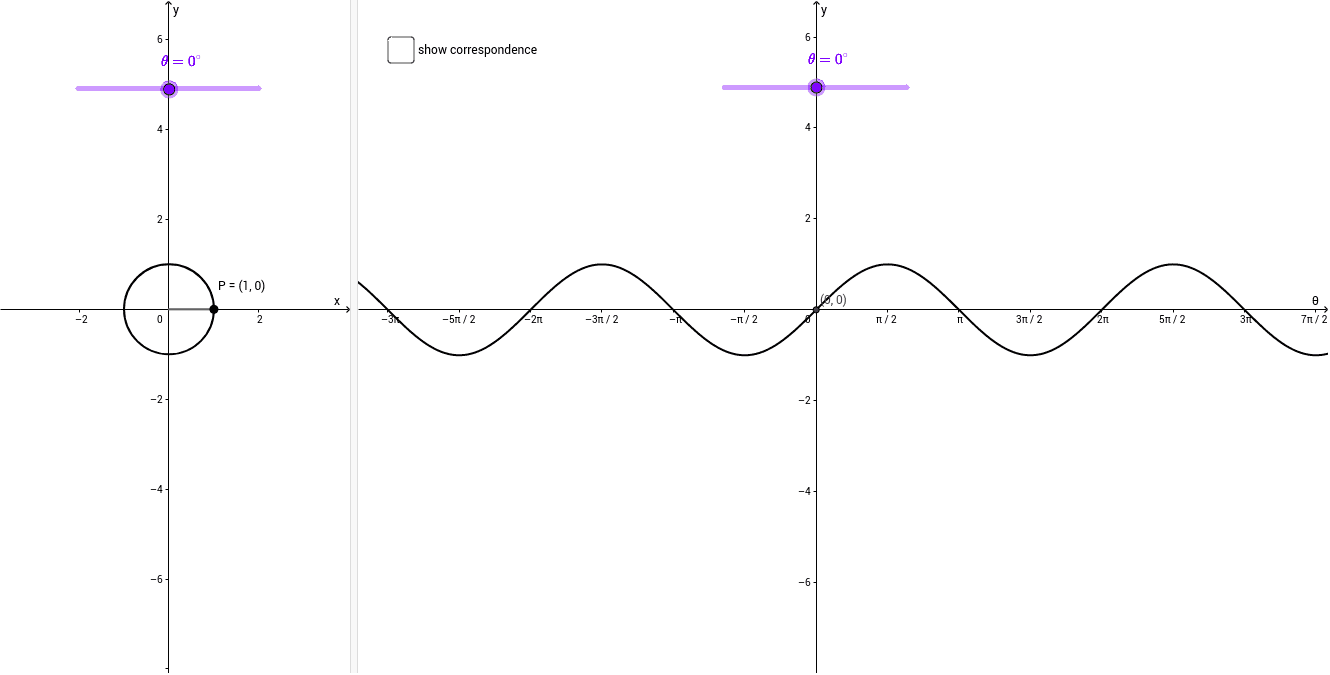
This example demonstrates the relationship between the unit circle and the sine graph. Key mathematical concepts include the unit circle and the sine function and its graph. Using GeoGebra commands such as Intersect, Point, Circle, and CurveCartesian, the correspondence between the sine function and the unit circle is dynamically illustrated. Suitable for high school mathematics education and learning.
GeoGebra Commands & Parameters
Intersect(xAxis, yAxis) → APoint(xAxis) → BCircle(A, B) → cCurveCartesian(((t / 70 + 0.07) * cos(t)), ((t / 70 + 0.07) * sin(t)), t, 0, (ang * π / 180)) → bCurveCartesian(((abs(t) / 70 + 0.07) * cos(t)), ((abs(t) / 70 + 0.07) * sin(t)), t, (ang * π / 180), 0) → b_1Segment(A, P) → aSegment(C, D) → dIntersect(ang, yAxis, 1) → ESegment(P, F) → eIntersect(f, xAxis, (0, 0)) → GSegment(G, D) → g
AI Drawing Prompt Reference
Draw a unit circle and a ray from the center at an angle of ang degrees, which intersects the y-axis at point E and the x-axis at point G. Inside the unit circle, draw a sine curve that intersects the circle at point P in the first quadrant and the x-axis at point F. Draw a line segment from the center to point P, another from the center to point D, a line segment from point P to point F, and a line segment from point G to point D.
The prompt above was compiled from the original drawing commands and is for reference only.