
Vertical Graph Transformations
Loading the math board and drawing, please wait…
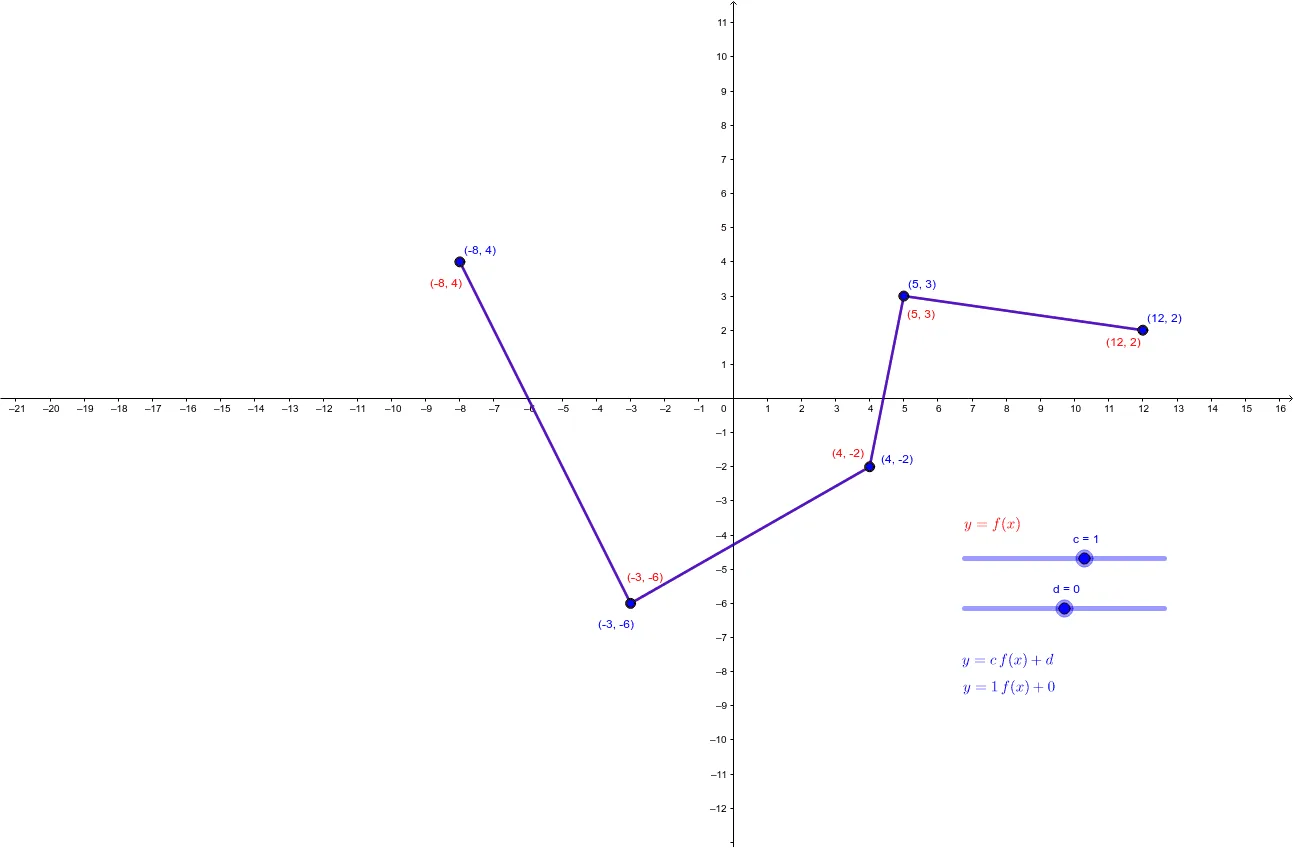
This example demonstrates how to move function graphs through vertical transformations and observe the change patterns. The core mathematical concepts involved include the translation of function graphs, transformation properties, and the application of coordinate systems. Construction highlights extracted from the 'Construction Summary' using GeoGebra commands/objects: Segment (line segment), objects P, Q, R, S, T, f, g, h, i, c, d, A, B, C, D, E, j, k, l, m, text1, A_1, B_1, C_1, D_1, E_1, text2_1, text2. Suitable for high school mathematics function graph transformation teaching, helping students understand the geometric meaning of function shifts.
GeoGebra Commands & Parameters
Segment(P, Q) → fSegment(Q, R) → gSegment(R, S) → hSegment(S, T) → iSegment(A, B) → jSegment(B, C) → kSegment(C, D) → lSegment(D, E) → m
AI Drawing Prompt Reference
Draw a function graph showing vertical transformations and movement patterns. Include multiple line segments connected sequentially to form a path, with key points labeled. Start with a line segment, then connect subsequent points in order, creating several continuous segments. Finally, label each part and show the transformation relationships to help understand the translation properties of function graphs.
The prompt above was compiled from the original drawing commands and is for reference only.