
Unit Circle and Graphs of Sin, Cos & Tan by GeoGebra Institute of MEI
Loading the math board and drawing, please wait…
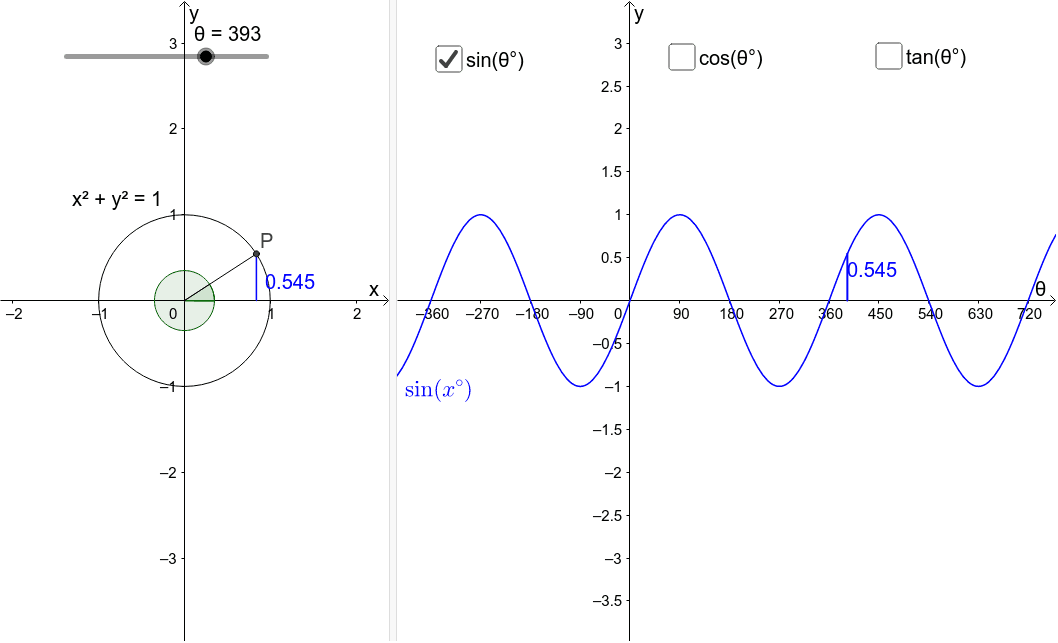
This example demonstrates the relationship between the coordinates of a point P on the unit circle and the graphs of sine, cosine, and tangent functions. Core math concepts include the unit circle, trigonometric functions, function graphs, and angle measurement. It uses GeoGebra commands/objects like Intersect, Rotate, Angle, Segment, Midpoint, and Tangent. Suitable for high school students learning about the generation process and properties of trigonometric function graphs.
GeoGebra Commands & Parameters
Intersect(circle, xAxis, 2) → AIntersect(xAxis, yAxis) → BRotate(A, θ°, B) → PAngle(A, B, P) → αAngle(P, B, A) → βRotate(A, 359.9*°, B) → A'Angle(A, B, A') → γRotate(A, 359.9*°, B) → A'_1Rotate(A, 359.9*°, B) → A'_2Angle(A, B, A'_2) → δRotate(A, 359.9*°, B) → A'_3Angle(A, B, A'_3) → εSegment((x(P), 0), P) → aSegment(B, P) → bSegment((θ, 0), (θ, y(P))) → dMidpoint(C, P) → DMidpoint(E, F) → GSegment(B, C) → eMidpoint(B, C) → HSegment(E, I) → hMidpoint(E, I) → JTangent(P, circle) → k,Intersect(k, xAxis) → KSegment(P, K) → lMidpoint(K, P) → LSegment(E, M) → mMidpoint(M, E) → N
AI Drawing Prompt Reference
Draw a unit circle and plot the graphs of sine, cosine, and tangent functions based on a point P on the circle. Start by drawing the unit circle, then find the intersection point A of the circle and the x-axis, and the origin O. Rotate point A 359.9 degrees around O to get A', and repeat to get A'_1, A'_2, and A'_3. Draw a tangent line from P to the circle, intersecting the x-axis at K, and draw line segment PK. Draw a vertical line from P to the x-axis, intersecting the circle at C, and draw line segment BC. Find the midpoint of BC and draw line segment e, and draw line segment BC. Draw line segment a from (x(P), 0) to P, line segment b from B to P, and line segment d from (θ, 0) to (θ, y(P)).
The prompt above was compiled from the original drawing commands and is for reference only.