
Unequal Probability Demonstration
Loading the math board and drawing, please wait…
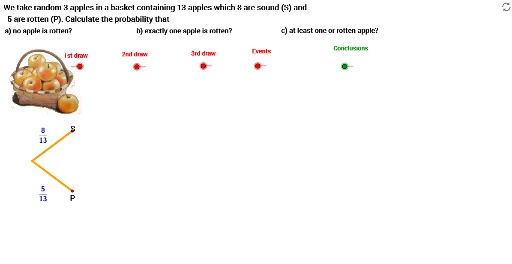
This example demonstrates how to visualize and calculate unequal probability distributions using GeoGebra. It involves core math concepts like Probability & Statistics, Linear Equations, Standard Deviation, Polygons, and Integral Calculus. The construction utilizes commands/objects such as Point, Outil1, and Vector. Suitable for high school and above learners to understand the application of probability in geometry.
GeoGebra Commands & Parameters
Point(yAxis) → BOutil1(A, B) → aPoint(yAxis) → COutil1(A, C) → bOutil1(D, E) → cOutil1(F, G) → dOutil1(N, O) → hOutil1(P, Q) → iOutil1(L, M) → gOutil1(L, U) → kOutil1(F, I) → eOutil1(D, K) → fOutil1(P, H) → jOutil1(N, J) → lOutil1(R, S) → mOutil1(R, T) → nVector(V, W) → uVector(Z, A1) → vVector(B1, C1) → wVector(D1, E1) → z