
Undamped Forced Oscillations
Loading the math board and drawing, please wait…
In collections
UQ-Applied Mathematical Analysis
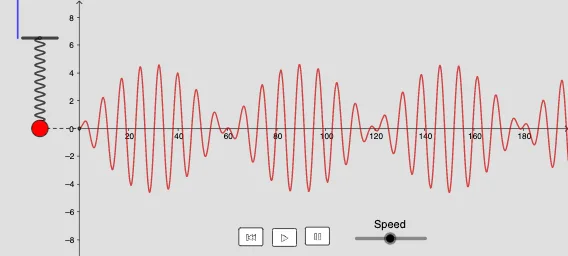
This example demonstrates undamped forced oscillations. Key mathematical concepts include oscillation equations and periodic functions. Using GeoGebra commands such as If, Element, and CurveCartesian, the oscillation curve can be constructed. Suitable for high school physics and mathematics education.
GeoGebra Commands & Parameters
If(ω ≠ ω_0, 1, 2) → indexIf(index ≟ 1, (F_0 * cos((ω * x))), (F_0 * cos((ω_0 * x)))) → ForceElement(List, index) → SolutionCurveCartesian((2 * sin((((10 * 2) * π) * (j - y_1) / y_l))) + x(B), j, j, y_1, y_0) → SSegment(PS, PS + (0, 0.5)) → endCurveCartesian((2 * sin((((10 * 2) * π) * (j - y_1) / y_l))) + x(B), j, j, y_0, y_1) → SauxSegment(C1, C2) → PlataformVector((0, 0), (0, (3 * Force(t)))) → uTranslate(u, (x(B) - 9, y(B))) → u'Segment(A, A') → LevelSegment((t, 0), A') → LevelTimeTextfield(a) → InputBox1Textfield(b) → InputBox2LaTeX(ω_0, true, true) → text1Textfield(m) → InputBox3Textfield(k) → InputBox4Textfield(F_0) → InputBox5Textfield(ω) → InputBox6
AI Drawing Prompt Reference
Draw a graph of undamped forced oscillations, including a platform, a force curve, and a horizontal line. The platform consists of two points, one at the origin and another on the x-axis. The force curve is calculated using input parameters F_0, ω, and x. The horizontal line intersects the platform to indicate the oscillation's horizontal position.
The prompt above was compiled from the original drawing commands and is for reference only.