
Two Graphs of Rate, Time, Amount
Loading the math board and drawing, please wait…
In collections
Rate & Accumulation Yr 4 Much&Fast
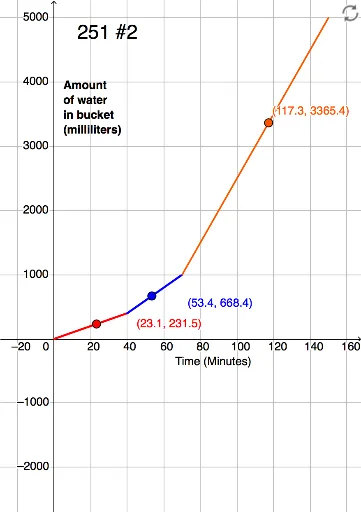
This example demonstrates the relationship between rate, time, and amount through dual graphs, visually showcasing function plots and data point distributions. Core mathematical concepts include coordinate geometry, quadratic functions, logarithmic functions, and similarity transformations. GeoGebra commands used in construction involve points, segments, texts, sliders, and function graphing. Suitable for high school and above learners to understand function graphs, geometric transformations, and data analysis.
GeoGebra Commands & Parameters
Point(AC2) → BPoint(AC3) → DPoint(AC1) → CSegment(A, F) → gSegment(F, G) → hSegment(G, H) → iPoint(g) → IPoint(h) → JPoint(i) → KSegment(M, L) → jPoint(j) → NSegment(G, L) → kPoint(k) → O
AI Drawing Prompt Reference
Draw two function graphs, one quadratic and one logarithmic, to show the relationship between rate, time, and amount. Mark key points on the coordinate system and connect them with line segments to form data distributions. Use sliders to adjust parameters and observe transformations and similarities in the function graphs, suitable for high school and above learners to understand function graphs, geometric transformations, and data analysis.
The prompt above was compiled from the original drawing commands and is for reference only.