
Turkey Shape Probability Demo
Loading the math board and drawing, please wait…
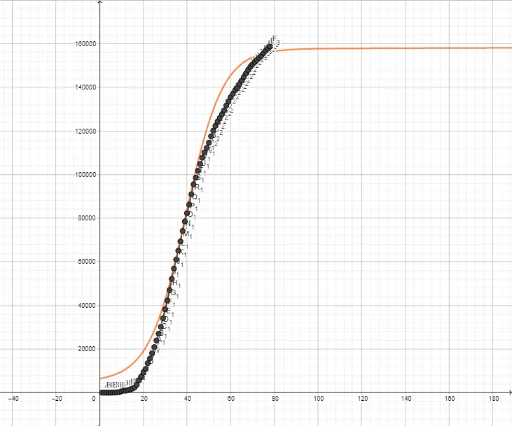
This example demonstrates the relationship between normal distribution and inequalities through dynamic geometry. It involves core concepts like probability, normal distribution, inequalities, and hyperbola. Points (A1-B20) are used to construct shapes and loci. Suitable for high school mathematics teaching, illustrating the integration of probability statistics and analytical geometry.
GeoGebra Commands & Parameters
1121354555647747819191911067011947129471312361415291518721624331736291856981974022092712110827221353123156792418135252092126239342727069283021729341093038226
AI Drawing Prompt Reference
Draw a dynamic geometry figure demonstrating the relationship between normal distribution and inequalities, involving core concepts like probability, normal distribution, inequalities, and hyperbola. Use points to construct shapes and loci, suitable for high school mathematics teaching, illustrating the integration of probability statistics and analytical geometry.
The prompt above was compiled from the original drawing commands and is for reference only.