
Truth & Equations Practice: Quadratics, Power Functions, and Calculus
Loading the math board and drawing, please wait…
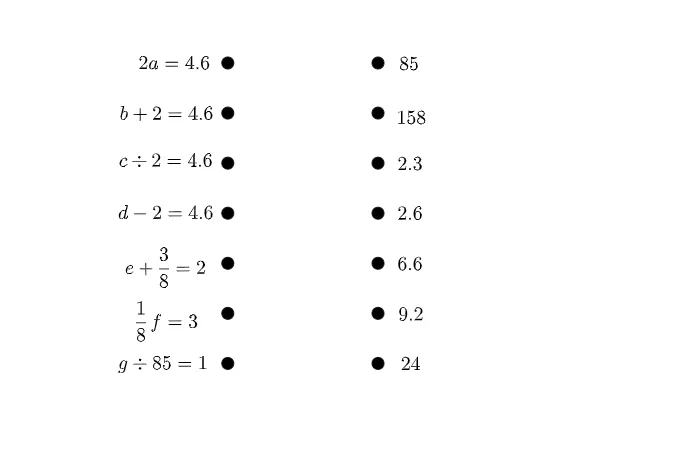
This GeoGebra practice demonstrates how “truth” (whether an equation holds) can be visualized through geometry—linking valid solutions to key points and their positions on graphs. The example centers on quadratic equations and their special points, power functions and their behavior, and interpreting solutions via graphical relationships such as intersections or point substitution. The construction uses many labeled geometric point objects (A through N) to represent key/control points and multiple text annotations (text1 through text14) to present which statements are true/false at chosen locations and to label corresponding mathematical results. It is well suited for advanced secondary school learners and early university students studying algebraic equations, function graphs, and an introduction to differential calculus concepts.
GeoGebra Commands & Parameters
Point A(-8, 3)Point B(-8, 2)Point C(-8, 1)Point D(-8, 0)Point E(-8, -1)Point F(-8, -2)Point G(-8, -3)Point H(-5, 3)Point I(-5, 2)Point J(-5, 1)Point K(-5, 0)Point L(-5, -1)Point M(-5, -2)Point N(-5, -3)
AI Drawing Prompt Reference
Draw two vertical columns of seven points each on a coordinate plane, located at x-coordinates -8 and -5. In each column, points are spaced evenly from y=3 down to y=-3. These points serve as markers for evaluating function values and illustrating true/false statements about quadratic equations, power functions, and basic calculus concepts. Add light grid lines for reference, and keep the layout symmetric with two parallel point sets.
The prompt above was compiled from the original drawing commands and is for reference only.