
Trigonometry and Hyperbola
Loading the math board and drawing, please wait…
In collections
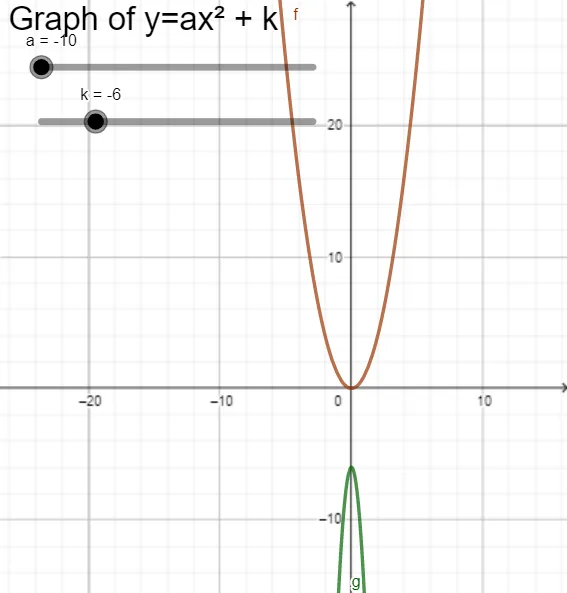
Graph of Quadratic Equation
This example demonstrates the relationship between trigonometric functions and hyperbolas. By adjusting parameters, one can observe the changes in the trigonometric function graphs and their intersections with the hyperbola. Key mathematical concepts include trigonometric functions, hyperbolas, and their geometric properties. It utilizes functions, slider animation, and locus in GeoGebra. Suitable for high school mathematics education and learning.
GeoGebra Commands & Parameters
f(x) = x^(2)Numeric a(-10)Numeric k(-6)g(x) = (a * x^(2)) + k
AI Drawing Prompt Reference
Draw a Cartesian coordinate plane with grid lines. Start with a basic upward-opening parabola whose vertex is at the origin. Then introduce two adjustable numeric parameters: one controls the width of the parabola's opening, and the other shifts the entire curve vertically along the y-axis. The final graph is a transformed parabola determined by these two parameters. Clearly show the coordinate axes, the parabola's full curve, its vertex, and its axis of symmetry, so that the effects of parameter changes on shape and position are visible.
The prompt above was compiled from the original drawing commands and is for reference only.