
Secant Line and Bar Chart
Loading the math board and drawing, please wait…
In collections
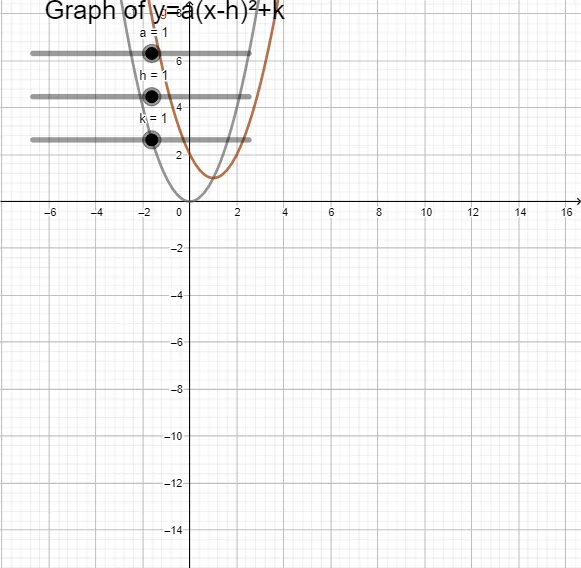
Graph of Quadratic Equation
This example demonstrates the concept of a secant line and its application in bar charts. By adjusting parameters, one can observe how the secant line intersects with the function graph and generates corresponding bar charts. The example involves the concept of a secant line in coordinate geometry and the representation of statistics through bar charts. Using GeoGebra commands f, a, h, k, g, and text1, a dynamic secant line and bar chart can be constructed. Suitable for high school mathematics teaching, particularly in coordinate geometry and statistics courses.
GeoGebra Commands & Parameters
f(x) = x^(2)Numeric a(1)Numeric h(1)Numeric k(1)g(x) = (a * (x - h)^(2)) + k
AI Drawing Prompt Reference
Draw a parabola and add a secant line passing through two points on the parabola with x-coordinates 1 and 2. Generate a bar chart based on the intersection points of the secant line with the parabola, showing the relationship between the secant line and the parabola. Adjust parameters to observe how the secant line changes and how the bar chart updates accordingly, suitable for high school mathematics teaching on coordinate geometry and statistics.
The prompt above was compiled from the original drawing commands and is for reference only.