
Trigonometric & Confidence Interval Interactive Demo
Loading the math board and drawing, please wait…
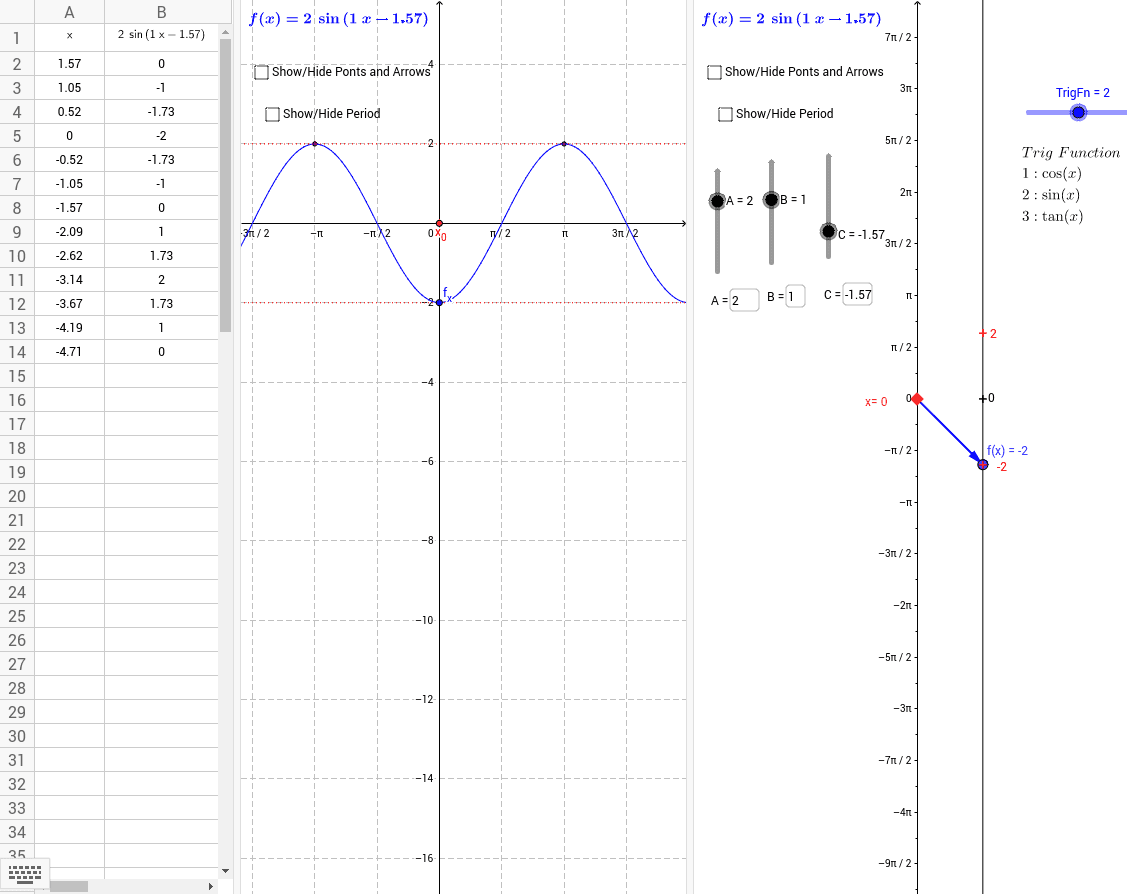
This example demonstrates the integration of trigonometric functions and confidence intervals through interactive graphics. It involves core concepts like trigonometric functions, confidence intervals, vector operations, and geometric constructions. Constructed using commands like Element, Point, Vector, Segment, Sequence, Textfield, Derivative, Zip in GeoGebra. Suitable for high school and above mathematics education, helping students understand function graphs, geometric transformations, and statistical concepts.
GeoGebra Commands & Parameters
Element(TrigL, TrigFn) → fPoint(yAxis) → aVector(a, f_a) → uSegment(C_1, D) → eVector(E, F) → vSequence((k, f(k)), k, C - π, C + π, 0.5235987755982988) → list1Sequence(Vector[(0, k), (2, f(k))], k, C - π, C + π, 0.5235987755982988) → list2Sequence(Segment[(i, f(i)), ((2 * C) - i, f((2 * C) - i))], i, C - π, C, 0.5235987755982988) → list3Vector(G, H) → wSegment(f_x, J) → jSequence(Segment[(i, f(i)), (π - i, f(π - i))], i, 0, 3.141592653589793, 0.5235987755982988) → suplTextfield(B) → inputBox1Textfield(C) → InputBox1Derivative(f) → f'Vector(f_a, (2, y(f_a) + f'(y(a)))) → hSequence(-5, 5) → nlistZip(((1 / B * ((2 * k) + 1)) * π / 2) - C / B, k, nlist) → xtrslistZip((z, f(z)), z, xtrslist) → xtrsptsZip(((1 / B * k) * π) - C / B, k, nlist) → xrtclistZip((z, f(z)), z, xrtclist) → xtrcptsTextfield(A) → InputBox2Segment(a, Q) → lSegment(a, P) → mVector(P, f_a) → nVector(Q, f_a) → pSegment(f_x, M) → sSegment(f_x, R) → q
AI Drawing Prompt Reference
Draw a trigonometric function graph and display its confidence interval. Start by plotting the coordinate axes and origin, then sketch the trigonometric curve. Next, create vectors from the origin to points on the curve and use these to construct geometric shapes like segments and triangles. Generate multiple points using sequences and connect them with lines to form several curves. Finally, add text boxes and derivative curves to illustrate statistical and geometric transformation concepts.
The prompt above was compiled from the original drawing commands and is for reference only.