
Triangular Normal Probability Demo
Loading the math board and drawing, please wait…
In collections
Complex Math
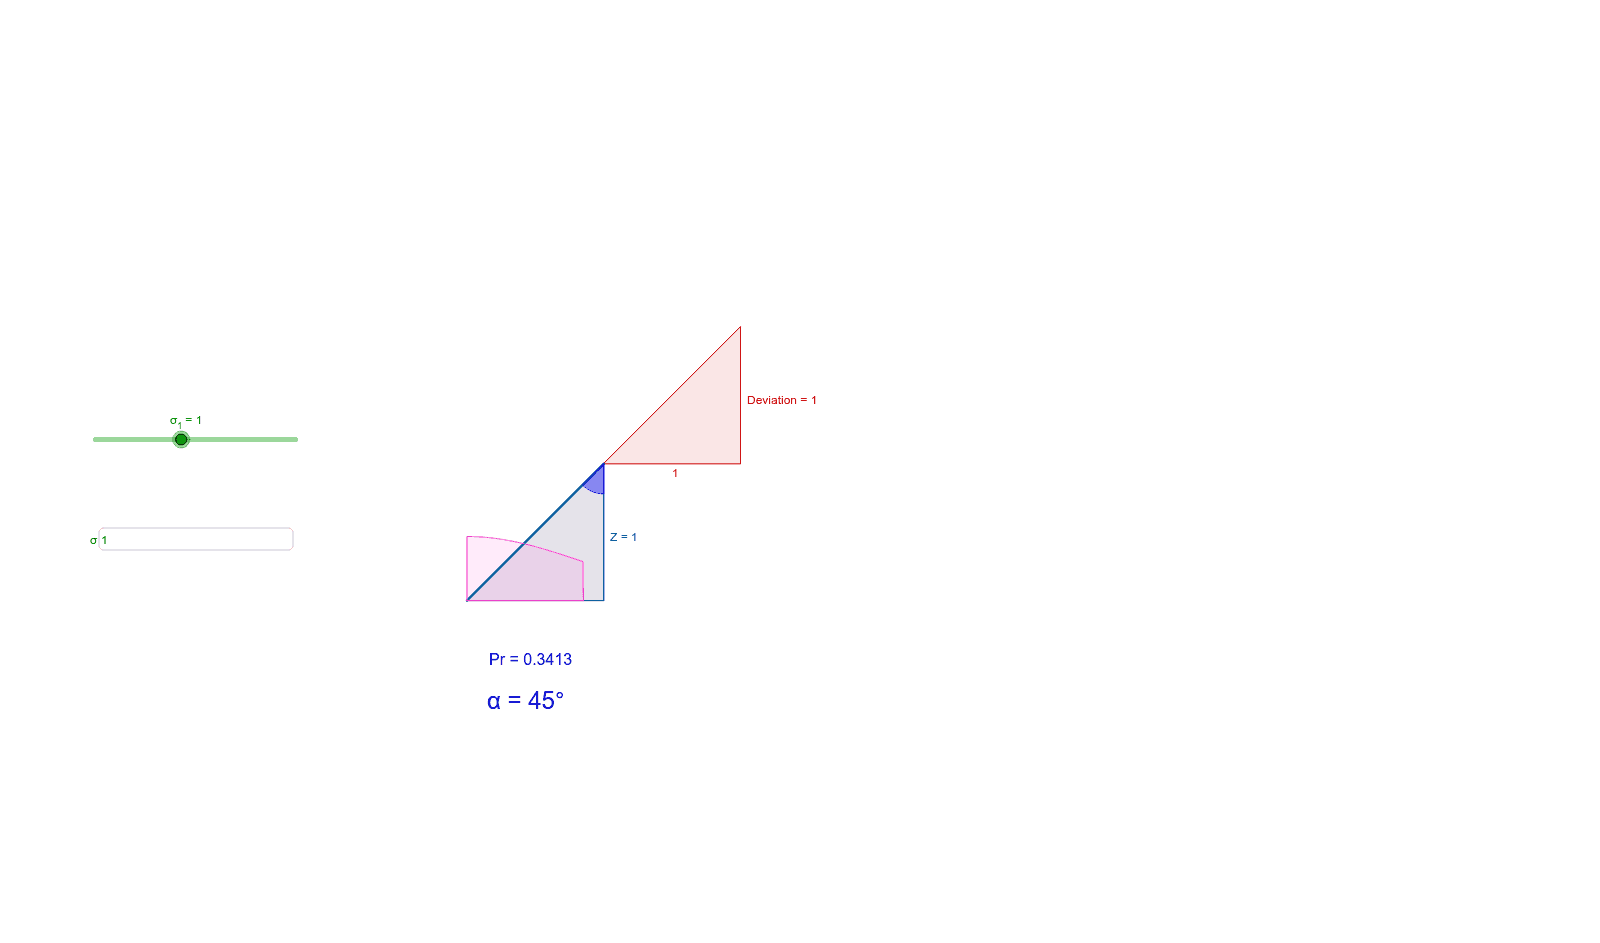
This example demonstrates the relationships of quantities involved in the Normal Curve through a graphical representation. Key math concepts include Normal Distribution, Integral, Mean, and Standard Deviation. It is constructed using GeoGebra commands like Integral, Point, Polygon, Slope, Textfield, and Angle. Suitable for high school and above students to understand probability calculations and geometric interpretations of the Normal Distribution.
GeoGebra Commands & Parameters
Integral(f_1, -Infinity, Infinity) → aIntegral(g, -10, 10) → sdPoint(d) → CPoint(d) → DPolygon(C, B, D) → poly1, d_1, c, hypPoint(hyp) → EPolygon(C, F, E) → poly2, f, c_1, χhypPoint(z) → GPolygon(C, B, G) → poly3, g_1, Z, b_1Slope(hyp) → DeviationPoint(h) → HIntegral(h, -200, 200) → ΣSTextfield(σ_1) → inputBox1Textfield(A) → inputBox2Textfield(n) → inputBox3Integral(g, 0, 0.851) → pIntegral(h(x) / σ_1, 0, 0.851) → probAngle(C, D, B) → αTextfield(σ_1) → InputBox1