
Triangle Inequality Theorem Exploration by Mathguru
Loading the math board and drawing, please wait…
In collections
Inequalities in a Triangle
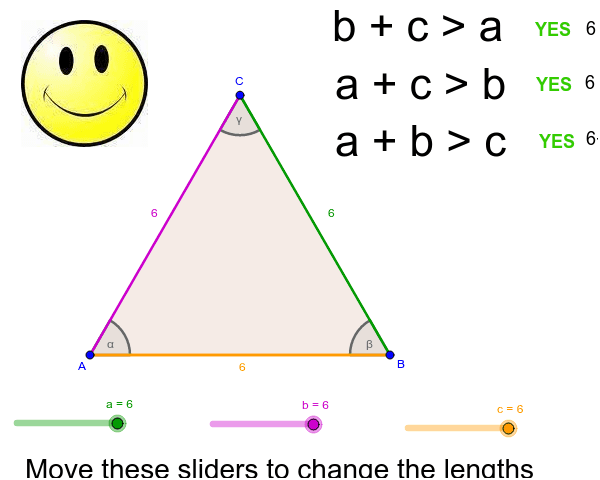
This GeoGebra dynamic worksheet enables learners to explore the Triangle Inequality Theorem interactively. By dragging vertices, users observe in real time that the sum of any two side lengths of a triangle always exceeds the third side. Core mathematical concepts include triangle properties, inequality relations, and geometric construction. The construction employs fundamental GeoGebra commands such as Point, Segment, Circle, Intersect, Polygon, Angle, and Midpoint to build a manipulative model. It is suitable for middle and high school geometry classes, helping students transition from concrete dynamic diagrams to abstract inequality reasoning.
GeoGebra Commands & Parameters
Point(Circle[A, c]) → BSegment(A, B) → dCircle(A, b) → eCircle(B, a) → fIntersect(e, f, 1) → CPolygon(A, B, C) → poly1, c_1, a_1, b_1Angle(poly1) → α, β, γPoint(e) → DSegment(A, D) → gMidpoint(g) → EPoint(f) → FSegment(B, F) → hMidpoint(h) → G
AI Drawing Prompt Reference
Draw a triangle to explore the Triangle Inequality Theorem. The triangle is formed by three points A, B, and C. Connect A and B to get line segment d. Draw circles centered at A and B with radii b and a, intersecting at point C. Form triangle poly1. Calculate the angles α, β, and γ of the triangle. Mark point D on circle e, connect A and D to get line segment g, and find its midpoint E. Mark point F on circle f, connect B and F to get line segment h, and find its midpoint G. Display these elements to help understand the Triangle Inequality Theorem.
The prompt above was compiled from the original drawing commands and is for reference only.