
Trapezoidal Method and Riemann Sum for Area Under Curve
Loading the math board and drawing, please wait…
In collections
Rate & Accumulation Yr 4 Much&Fast
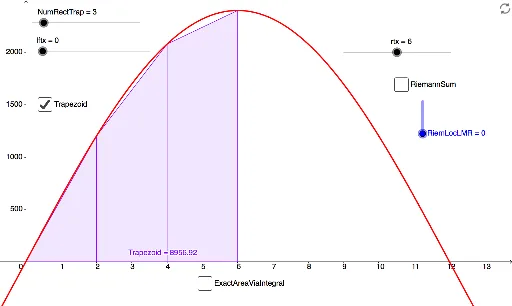
This example demonstrates how to estimate the area under a curve using the trapezoidal method and Riemann sum. Key mathematical concepts include integration and Riemann sum. Using GeoGebra commands such as Integral, TrapezoidalSum, and RectangleSum, the area under the curve can be approximated. Suitable for high school math education and learning calculus concepts.
GeoGebra Commands & Parameters
Integral(f, lftx, rtx) → IntegralTrapezoidalSum(f, lftx, rtx, NumRectTrap) → TrapezoidRectangleSum(f, lftx, rtx, NumRectTrap, RiemLocLMR) → RiemannSum
AI Drawing Prompt Reference
Draw a function curve and illustrate how to estimate the area under the curve using the trapezoidal method and Riemann sum. First, plot the function curve, then draw trapezoidal bars below the curve to represent the trapezoidal method approximation, and also draw rectangular bars to represent the Riemann sum approximation, allowing viewers to intuitively understand the concepts of integration and estimation methods.
The prompt above was compiled from the original drawing commands and is for reference only.