
Translation of Function Graphs
Loading the math board and drawing, please wait…
In collections
trasformazioni di grafici
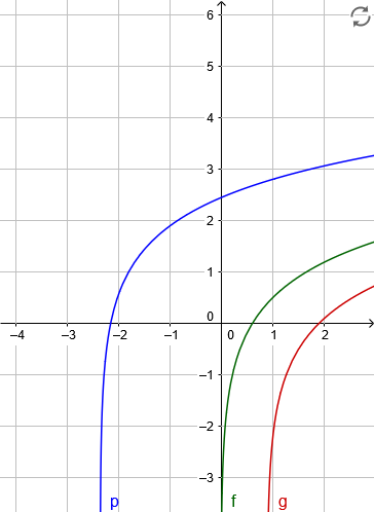
This example demonstrates the translation (shifting) of function graphs in the plane, allowing users to observe how a function curve moves horizontally and vertically as parameters are adjusted. The core mathematical concept is the transformation of functions, specifically the translation form f(x-h)+k, where h controls horizontal shift and k controls vertical shift. The construction involves defining a base function f and creating translated versions (g, h, etc.) using GeoGebra objects such as sliders or parameters to control the shift amounts. Multiple function objects (k, l, m, p) may be used to illustrate different translation combinations. This resource is suitable for middle or high school mathematics, helping students intuitively grasp how translations affect function graphs and explore the relationship between the graph and the algebraic expression of the function.
GeoGebra Commands & Parameters
Numeric k(0.5)f(x) = k + log(x)Numeric h(-0.9)g(x) = log(x + h)Numeric l(1.6)Numeric m(2.35)p(x) = l + log(m + x)