
Translating and Graphing Basic Inequalities
Loading the math board and drawing, please wait…
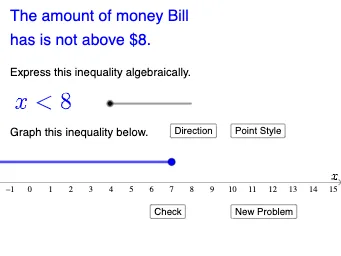
This example demonstrates how to translate and graph basic inequalities, covering core mathematical concepts such as inequality representation, number line notation, and region partitioning. Key GeoGebra commands and objects used include Random, Point, If, Ray, RandomElement, and elements like b, c, a, n, A, v3, text1, button1, f, g, text3, d, e, h, i, j, t3, k, text5_{1}, button2, button3, m, o, p, q, text8, text7, t2, v2, v1, text10, button4, l1, text5, t1. Suitable for middle school and above students to learn and understand the basic properties and applications of inequalities.
GeoGebra Commands & Parameters
Random(1, 14) → cRandom(1, 10) → nPoint(Segment[(0, 1), (15, 1)]) → AIf(n ≟ 1, "at least", n ≟ 6, "does not exceed", n ≟ 7, "is below", n ≟ 8, "is not below", n ≟ 9, "is above", n ≟ 10, "is not above", n ≟ 2, "at most", n ≟ 3, "more than", n ≟ 4, "less than", n ≟ 5, "exceeds") → text1Ray(A - (0.2, 0), A - (1, 0)) → fRay(A + (0.2, 0), A + (1, 0)) → gIf(q ≟ 1, "<", q ≟ 2, "≤", q ≟ 3, ">", q ≟ 4, "≥") → text8If(v1 ≟ (¬v2), "One part is incorrect.", (¬v1) ∧ (¬v2), "Both parts are incorrect.") → text10RandomElement(l1) → text5
AI Drawing Prompt Reference
Draw a point A on a number line between 0 and 15. Draw two rays from A, one to the left and one to the right, labeled f and g. Add text labels around the rays and point to indicate inequality meanings. Ensure the graph clearly shows the division of regions for inequalities.
The prompt above was compiled from the original drawing commands and is for reference only.