
Translated Trigonometric Functions
Loading the math board and drawing, please wait…
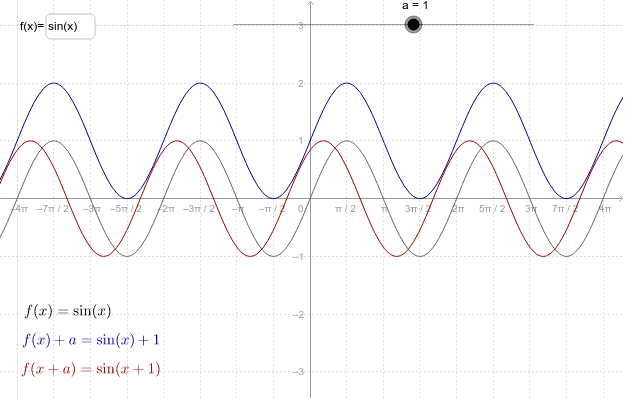
This example demonstrates the graphs of cos(x), tan(x), and x^3. It involves the concepts of trigonometric functions and function translation. By entering the function expressions in the input box, GeoGebra automatically draws the graphs. This example is suitable for high school mathematics education, helping students understand the translation transformations of trigonometric functions.
GeoGebra Commands & Parameters
Textfield(f) → inputBox1
AI Drawing Prompt Reference
Draw a coordinate plane with three function curves: cosine, tangent, and cubic. The cosine curve is a smooth wave oscillating above and below the x-axis. The tangent curve consists of separate rising branches with vertical asymptotes. The cubic curve passes through the origin, rising from lower left to upper right. Use different colors for each curve and label them. Include an input box where users can type a new function expression to see how translation affects the graph. The layout should be clear for high school math teaching.
The prompt above was compiled from the original drawing commands and is for reference only.