
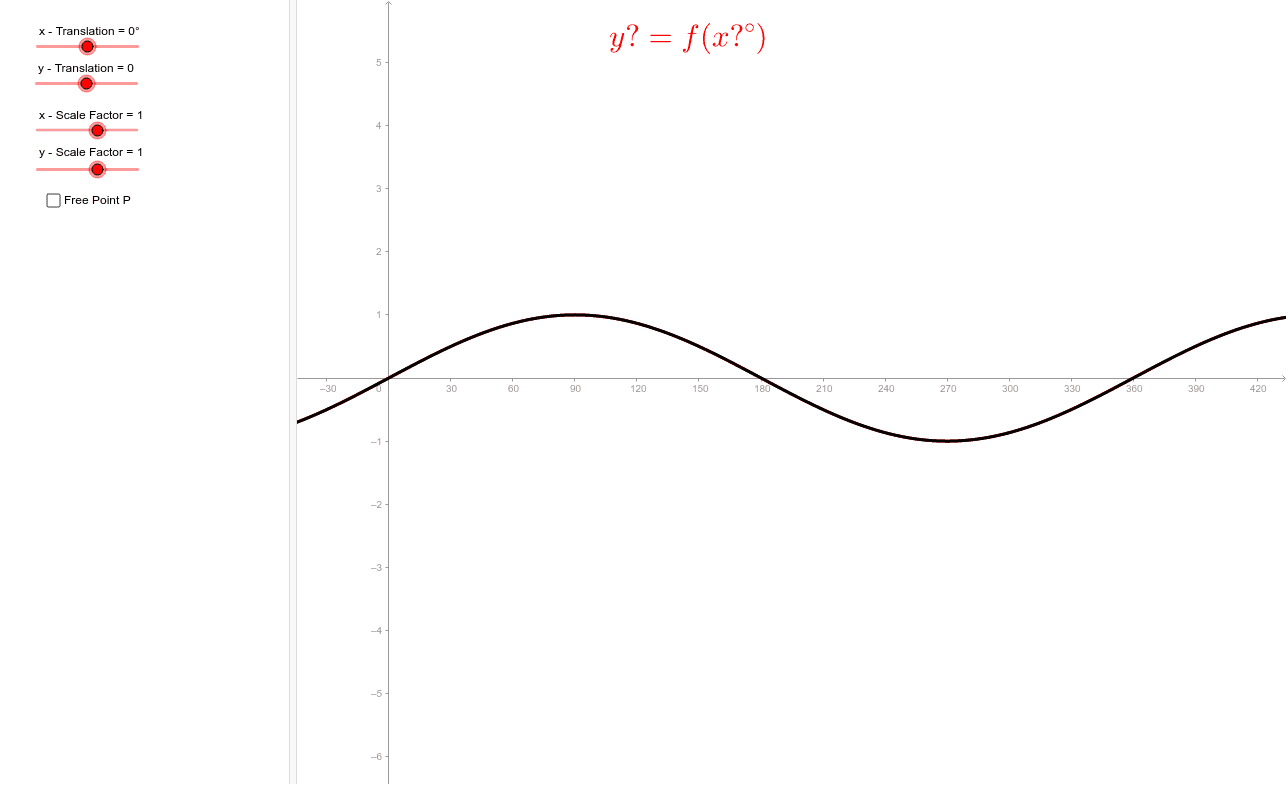
Transforming a Sine Curve
Loading the math board and drawing, please wait…
This example demonstrates how to transform a sine curve using parameters. It involves core math concepts like function transformations, trigonometric graphs, parametric equations, and coordinate geometry. Constructed with GeoGebra commands like Point, If, Segment, and objects such as point A, parameters a and b, function f, and transformed function g. Suitable for high school mathematics education to understand the principles and effects of translation and scaling transformations on function graphs.
GeoGebra Commands & Parameters
Point(xAxis) → AIf(b > 0, " - ", If[b ≟ 0, "", " + "]) → ySignIf(a > 0, " - ", If[a ≟ 0, "", " + "]) → xSignIf(b > 0, b, If[b < 0, (-b), ""]) → bAbsIf(a > 0, a, If[a < 0, (-a), ""]) → aAbsSegment(P, (x(P), 0)) → cSegment(P, (0, y(P))) → dSegment(P', (x(P'), 0)) → eSegment(P', (0, y(P'))) → h
AI Drawing Prompt Reference
Draw a sine curve and transform it using parameters a and b. First, determine the start and end points of the curve. Then, adjust the curve's shape and position based on the values of a and b. Ensure the curve is correctly displayed in the coordinate system while maintaining its mathematical properties.
The prompt above was compiled from the original drawing commands and is for reference only.