
Transformations of the Sine Graph by Lindsay McLanachan
Loading the math board and drawing, please wait…
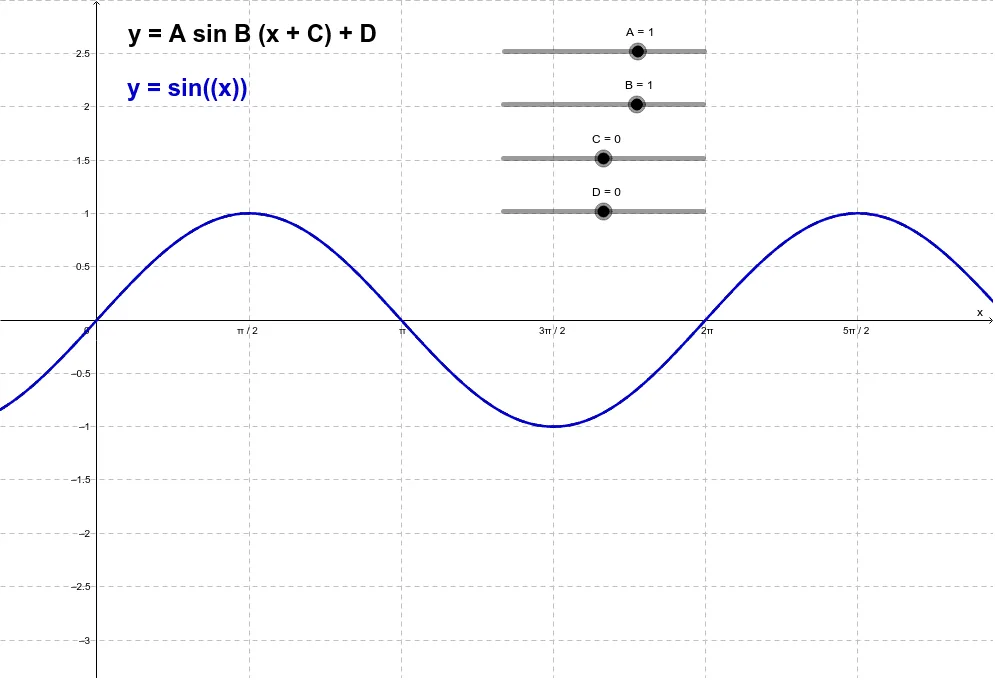
This example demonstrates the transformations of the sine function graph, including translations and scalings. Key math concepts involved are function transformations, sine graph, coordinates, and tangent lines. GeoGebra commands used include objects f (function), A, B, D, C (points), g (function), text2, text1 (text). Suitable for high school mathematics teaching to understand function graph transformation rules.
GeoGebra Commands & Parameters
f(x) = sin(x)Numeric A(1.0)Numeric B(1.0)Numeric D(0.0)Numeric C(0.0)g(x) = (A * sin((B * (x + C)))) + D
AI Drawing Prompt Reference
Draw a sine function graph and its transformations through translations and scalings. First, plot the basic sine curve, then mark several key points in the coordinate system, and draw the transformed sine curve while labeling the relevant translation and scaling parameters to observe the changes in the function graph.
The prompt above was compiled from the original drawing commands and is for reference only.