
Transformations of the Sine Function
Loading the math board and drawing, please wait…
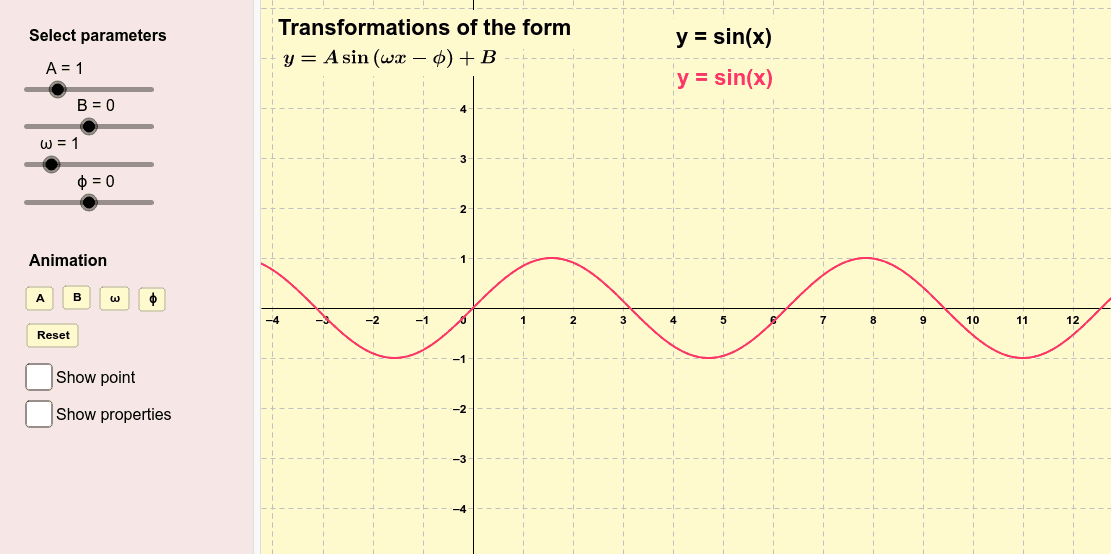
This example demonstrates the effects of transformations on the sine function, including translations, stretches, and phase shifts. Key math concepts involve the sine function, graph transformations, amplitude, frequency, and phase. It is constructed using GeoGebra commands like f, A, B, ω, ϕ, g, StateA, StateB, Stateω, Stateϕ, buttons, and text elements. Suitable for high school mathematics education to understand function transformation rules.
GeoGebra Commands & Parameters
f(x) = sin(x)Numeric A(1)Numeric B(0)Numeric ω(1)Numeric ϕ(0)g(x) = (A * sin((ω * x) + ϕ)) + BNumeric StateA(0)Numeric StateB(1)Numeric Stateω(0)Numeric Stateϕ(0)(((-ϕ)) / ω, g(((-ϕ)) / ω))Boolean a(false)Boolean b(false)
AI Drawing Prompt Reference
Draw a sine function graph and demonstrate the effects of translations, stretches, and phase shifts. Start by plotting the basic sine curve, then show transformed curves with adjusted amplitude, frequency, and phase, labeling key transformation states. Use different colors to distinguish the original function from the transformed ones, and display the values of amplitude, frequency, and phase shifts on the graph.
The prompt above was compiled from the original drawing commands and is for reference only.