
Transformations of Sine Function f(x)=a sin(bx)+d
Loading the math board and drawing, please wait…
In collections
Sine and Cosine Functions
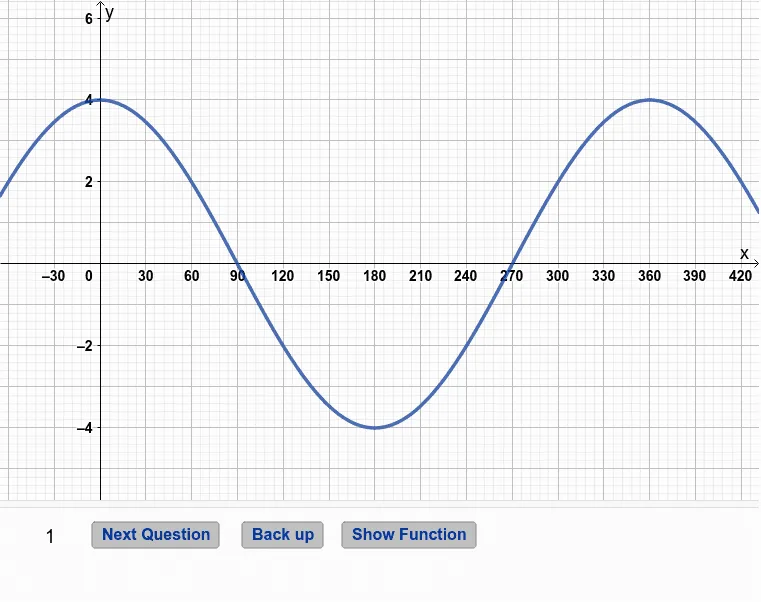
This GeoGebra example dynamically demonstrates the transformation of the sine function in the form f(x) = a sin(bx) + d, using sliders to adjust parameters a (amplitude), b (frequency/period), and d (vertical shift). It visually illustrates how each parameter affects the graph's shape, including stretching/compressing, horizontal shifting, and vertical translation. The construction utilizes function objects, sliders, and text annotations to support interactive learning. Ideal for high school trigonometry, function transformation units, or introductory calculus wave analysis. It reinforces the relationship between algebraic parameters and graphical properties, enabling students to explore and conjecture independently.
GeoGebra Commands & Parameters
f1(x) = (4 * cos(x°))f2(x) = (-3 * cos(x°))f3(x) = (2 * sin(x°)) + 4f4(x) = (-2 * sin(x°)) + 4f5(x) = (3 * cos(x°)) - 2f6(x) = (-4 * sin(x°)) + 1f7(x) = cos(((2 * x))°) + 1f8(x) = sin(((2 * x))°) - 3f9(x) = (3 * cos(((4 * x))°))f10(x) = (5 * sin(((6 * x))°))f11(x) = (4 * sin(((3 * x))°)) + 1f12(x) = (-2 * sin(((4 * x))°)) - 3Numeric q(1.0)Numeric a(12.0)Boolean b(false)
AI Drawing Prompt Reference
Draw multiple sine function graphs, adjust amplitude, frequency, and vertical shift using sliders to demonstrate the transformation process, including stretching/compressing, horizontal shifting, and vertical translation, with text annotations explaining the effect of each parameter on the graph.
The prompt above was compiled from the original drawing commands and is for reference only.